We Replaced $10,000/Month of VPC Flow Logs With About $10 of S3. Here's How, and What We Gave Up.
Network visibility is one of those line items nobody questions. Flow logs get turned on during an audit or after an incident, they quietly write data forever, and a year later someone opening Cost Explorer finds that the logs describing the network cost more than parts of the network itself.
That happened to us. Our VPC Flow Logs bill was running at roughly $10,000 a month. We replaced most of it with two things AWS and Linux already give you for free: Application Load Balancer access logs and the Linux connection-tracking table on our NAT instances. The new setup costs us somewhere between $5 and $10 a month.
This post covers what flow logs are, why organizations keep them, what we built instead, how reliable it is, and where it falls short of the real thing. If you run NAT instances and ALBs at scale, you can probably copy most of it.
What VPC Flow Logs are
VPC Flow Logs record metadata about IP traffic going to and from network interfaces in your VPC. They don’t capture packet contents. Each record summarizes a flow over a capture window (1 or 10 minutes) and looks roughly like this:
version account-id interface-id srcaddr dstaddr srcport dstport protocol packets bytes start end action log-status
2 123456789012 eni-0a1b2c3d 10.0.1.25 52.94.12.8 49152 443 6 120 84000 1697359200 1697359260 ACCEPT OK
You can enable them on a whole VPC, a subnet, or a single ENI, and send them to CloudWatch Logs, S3, or Amazon Data Firehose. Each record tells you:
- Who talked to whom (source and destination IP and port, protocol)
- How much (packets and bytes)
- When (start and end of the window)
- Whether AWS allowed it (ACCEPT or REJECT, based on security groups and network ACLs)
- Where, in AWS terms (ENI, subnet, VPC, account, and with custom formats, AZ, instance ID, and more)

VPC Flow Logs send traffic metadata to CloudWatch Logs, S3, and Data Firehose.
Flow logs are useful, which is why they’re hard to turn off. The usual reasons:
- Security investigations. “Did this compromised instance talk to that IP?” is the first question in almost every incident, and flow logs answer it.
- Troubleshooting connectivity. Timeouts, asymmetric routing, and misconfigured routes all show up as odd flow patterns.
- Cost and capacity analysis. Finding out which workload is driving NAT gateway or cross-AZ data transfer charges.
- Compliance. Frameworks like PCI DSS, SOC 2, and HIPAA often get read as “log network traffic,” and flow logs are the easiest box to tick.
Most of these needs are real. The problem is that the default way of meeting them, flow logs on every VPC with ALL traffic, gets expensive very fast at scale.
Flow logs are billed as vended logs. You pay per GB of log data generated, not per GB of network traffic. These are the tiered rates in us-east-1:
| Monthly volume | To CloudWatch Logs | To S3 / Firehose |
|---|---|---|
| First 10 TB | $0.50 / GB | $0.25 / GB |
| Next 20 TB | $0.25 / GB | $0.15 / GB |
| Next 20 TB | $0.10 / GB | $0.075 / GB |
| Over 50 TB | $0.05 / GB | $0.05 / GB |
On top of that, you pay for storage (CloudWatch Logs storage or S3), and for anything that queries the data: Logs Insights, Athena, or your SIEM’s ingestion fees, which are often the largest part of the bill.
A rough sense of scale. A default-format record is around 100–150 bytes. A busy fleet producing 1 billion records a day generates about 130 GB/day, or roughly 4 TB a month. That’s about $1,000/month delivered to S3, or about $2,000/month to CloudWatch, before storage and querying. Large organizations with many accounts, busy NATs, and lots of short-lived connections regularly land in the high four or five figures per month. Ours was about $10,000.
The important point: the bill is driven by the number of flows, not the number of bytes. A few huge long-lived transfers produce very few records. Millions of short API calls produce a flood of them.
Rethinking what we actually needed
When we looked at how we actually used our flow logs, almost every query fell into one of two buckets:
- Ingress: who is hitting our public endpoints, and how?
- Egress: what are our private workloads talking to on the internet?
All our internet ingress went through ALBs, and all our egress went through NAT instances (EC2 instances doing NAT, not managed NAT gateways). Both of those already know about every connection passing through them. We just needed to get that information out cheaply.
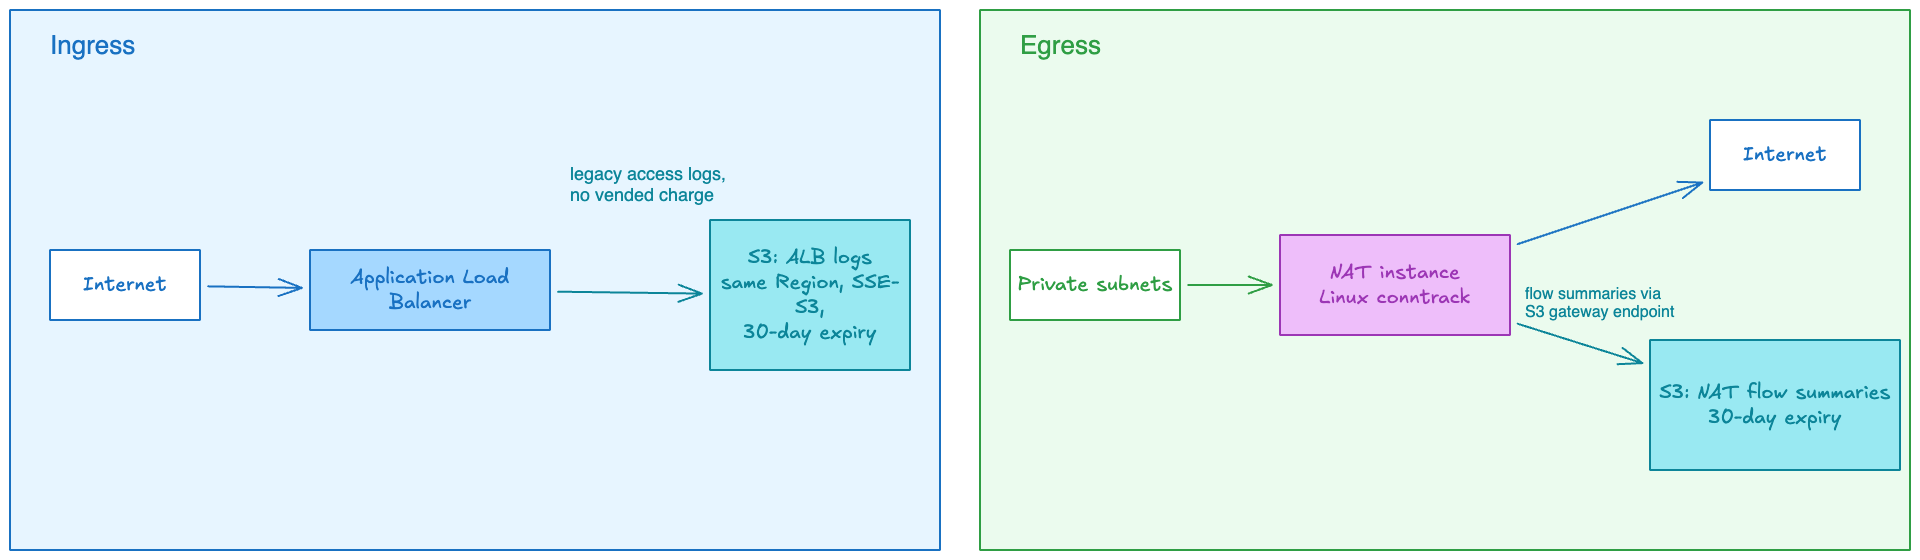
ALB access logs capture ingress; conntrack summaries capture NAT egress.
Neither path pays the vended-log charge. You pay only for S3 storage and requests.
Ingress with ALB access logs
How it works
An ALB runs on several nodes behind the scenes. Every node writes a gzip-compressed file of request records about every five minutes and delivers it to an S3 bucket you choose. Each record contains the client IP and port, the target, request and response timings, status codes, bytes, user agent, TLS cipher, and more. For HTTP traffic, that’s richer than a flow log.
Legacy ALB-to-S3 access logging carries no logging charge. You pay only for S3.
Setting it up
- Bucket in the same Region as the ALB.
- SSE-S3 encryption. This delivery path doesn’t support SSE-KMS.
- Bucket policy granting
s3:PutObjectto the ELB log delivery principal (logdelivery.elasticloadbalancing.amazonaws.com, or the Region-specific ELB account ID in some older Regions), scoped toarn:aws:s3:::<bucket>/<prefix>/AWSLogs/<account-id>/*. - One prefix per ALB. The prefix can’t contain the string
AWSLogs. - Block Public Access on, plus a policy statement denying requests where
aws:SecureTransportis false. - Lifecycle rule to expire objects after 30 days. If versioning is on, add a rule for noncurrent versions too, or “deleted” logs will keep costing money.
Then enable it on the ALB with the access_logs.s3.enabled, access_logs.s3.bucket, and access_logs.s3.prefix attributes. AWS writes an ELBAccessLogTestFile right away. Check it exists for every ALB; it proves the bucket policy works.
Reliability
AWS describes ALB access logs as best effort. Their documentation says outright that they shouldn’t be treated as a complete accounting of every request. In practice:
- Delivery is eventually consistent, so files can arrive late.
- Occasionally you’ll get duplicate files for the same interval.
- A busy ALB node can legitimately write several files for one interval.
That last point matters for processing: deduplicate by object key, never by time window, or you’ll throw away real data.
S3 isn’t the weak link. Once an object is written, it’s durable and immediately readable. The uncertainty is upstream, in the ALB’s delivery.
What we monitor:
- Age of the newest log object per ALB. We alert if it’s older than about 15 minutes.
- CloudTrail
ModifyLoadBalancerAttributesevents, so nobody can turn logging off quietly.
One warning: ALBs now also offer CloudWatch-based logging. Don’t turn it on. It’s billed as vended logs, which is exactly what we’re avoiding.
Egress with Linux conntrack on NAT instances
A Linux box doing NAT has to remember every connection, because when a reply packet comes back from the internet, the kernel needs to know which private IP and port to send it to. That memory is the connection tracking table, or conntrack. It exists whether you log anything or not.
Each entry holds:
- The original tuple: private source IP and port, destination IP and port, protocol
- The reply tuple: what the reply looks like, which shows the NAT translation
- Connection state and timeout
- Packet and byte counters in both directions, if
net.netfilter.nf_conntrack_acct=1 - Start and stop timestamps, if
net.netfilter.nf_conntrack_timestamp=1
The kernel can also stream changes to this table over a netlink interface called ctnetlink, as NEW, UPDATE, and DESTROY events. You can watch it with conntrack -E. With accounting on, a DESTROY event is basically a complete flow record: who, where, the NAT mapping, how long, and how many packets and bytes.
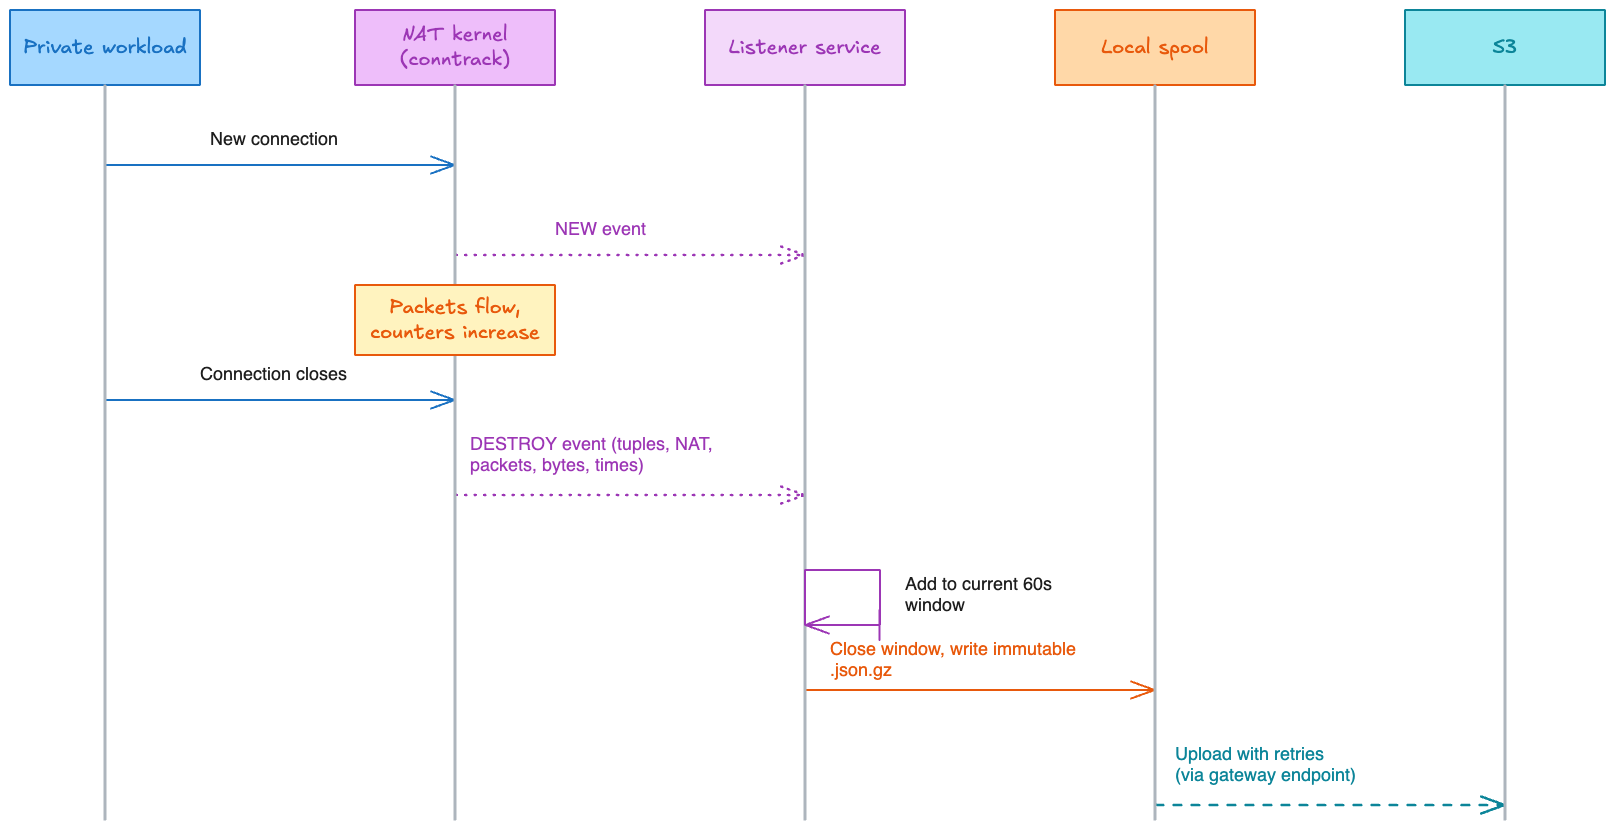
The listener records conntrack events, batches summaries, and uploads them to S3.
The catch: netlink drops events
Netlink is not a reliable transport. If the listener reads more slowly than the kernel produces events, the socket buffer fills, events get dropped, and the listener receives an ENOBUFS error. Your log quietly stops matching reality.
Bandwidth doesn’t predict this; connections per second do:
4 Gbit/s from a few long-lived streams     → a handful of events
1 Gbit/s from millions of short API calls  → a flood of events
For context, our busiest NATs moved about 550 TB a week combined, roughly 7.3 Gbit/s on average. That told us how to size the instances. It told us nothing about event rate, which we had to measure.
Building the listener properly
These are the rules we ended up with, most of them learned the hard way.
1. Run one persistent process. Don’t run conntrack -E for a minute, kill it, and start it again. Every restart is a window where events are lost. Run a single long-lived listener that rotates its output internally every 60 seconds.
2. Turn on accounting and timestamps first.
cat <<'EOF' > /etc/sysctl.d/90-conntrack-logging.conf
net.netfilter.nf_conntrack_acct = 1
net.netfilter.nf_conntrack_timestamp = 1
net.netfilter.nf_conntrack_events = 1
EOF
sysctl --system
These settings only apply to connections created after you enable them. Flows that were already open won’t have counters.
3. Treat counters as cumulative. UPDATE events report running totals, not increments. Track flows by conntrack ID plus tuple and keep the latest value. If you add up successive updates, you’ll overcount bytes badly.
4. Cover long-lived flows. A connection open for six hours only produces a DESTROY event at the end. To see it in the hours between, periodically snapshot the table (conntrack -L) and emit what changed, or emit “still active” records.
5. Reduce event volume where you can. If you only care about finished flows, subscribe only to DESTROY events (conntrack -E -e DESTROY) and rely on snapshots for long-lived connections. Increase the netlink receive buffer (conntrack -E -b <bytes> together with net.core.rmem_max).
6. Reconcile. At startup, after any ENOBUFS, and on a regular schedule, dump the full table and compare it with your in-memory state. That’s how you recover after losing events.
7. Mark gaps honestly. Flag a window as incomplete if any of these happened during it: an ENOBUFS, a listener restart, a table overflow (watch insert_failed and drop in conntrack -S), or a failed reconciliation. A log that admits its gaps is much more useful than one that hides them.
8. Spool locally, then upload. Write each finished window to local disk as an immutable gzip file, then upload with exponential backoff. If S3 is unreachable, files queue up. Keep the spool bounded; if the disk fills, drop the oldest files and record that you did.
9. Use deterministic, idempotent keys.
<region>/<instance-id>/<boot-id>/year=YYYY/month=MM/day=DD/hour=HH/<window-start>.json.gz
Including the instance ID and boot ID prevents collisions when instances are replaced or rebooted. Because a retry writes to the same key, it overwrites instead of duplicating. Send a checksum with each upload (for example x-amz-checksum-sha256).
10. Batch uploads. Collect in 60-second windows, but upload every 5–15 minutes. S3 PUT requests are the main cost here, as you’ll see below.
11. Filter out the NAT’s own traffic. The NAT instance itself talks to SSM, DNS, the instance metadata service, and S3, and all of that shows up in conntrack. Keep only flows whose original source is in your private dataplane CIDRs.
12. Use an S3 gateway endpoint. Attach one to the NAT subnet’s route table. It’s free, keeps uploads on the AWS network, and keeps your logging traffic out of the path you’re measuring.
13. Fail open. Logging must never interfere with packet forwarding. Run the listener at low priority with systemd limits (CPUQuota=, MemoryMax=, Nice=). If it crashes or the disk fills, NAT has to keep working.
Example:
{
  "schema": "conntrack-flow-summary/v1",
  "instance_id": "i-0abc123",
  "eni_id": "eni-0def456",
  "region": "us-east-1",
  "az": "us-east-1a",
  "proto": "tcp",
  "orig": { "src": "10.0.12.34", "sport": 51544, "dst": "52.94.12.8", "dport": 443 },
  "reply": { "src": "52.94.12.8", "sport": 443, "dst": "54.10.20.30", "dport": 51544 },
  "orig_packets": 120, "orig_bytes": 18400,
  "reply_packets": 140, "reply_bytes": 912000,
  "start": "2026-10-15T09:12:03Z",
  "end": "2026-10-15T09:12:41Z",
  "state": "TIME_WAIT",
  "action": "UNKNOWN",
  "window_complete": true
}
Notice action is UNKNOWN, not ACCEPT. More on that below.
Deploying across the fleet
We use AWS SSM associations that target NAT instances by tag. When an instance is replaced, it gets the sysctls, the service, and the config automatically, and configuration drift is corrected on a schedule. Each NAT’s instance role can only s3:PutObject to its own prefix.
People reading the logs use an IAM Identity Center role with MFA, read-only, and no delete permission. That’s better than a long-lived IAM user with access keys, which AWS itself advises against.
How this differs from VPC Flow Logs
This is the section to read before you copy anything. The new setup is not a VPC Flow Logs replacement in every respect. We deliberately call the NAT output conntrack-flow-summary, never “flow logs.”
| Capability | VPC Flow Logs | ALB access logs | Conntrack summaries |
|---|---|---|---|
| Coverage | Any ENI, VPC, or subnet | Only traffic through the ALB | Only traffic through the NAT |
| East-west (internal) traffic | Yes | No | No |
| ACCEPT / REJECT verdict | Yes | No | No (UNKNOWN) |
| Denied traffic | Yes | No | No; denied packets never reach the NAT |
| HTTP details (path, status, latency) | No | Yes | No |
| NAT translation visible | No | n/a | Yes |
| Bytes and packets | Per window | Per request | Per flow, both directions |
| Account, VPC, subnet IDs | Built in | Partial | Added from instance metadata |
| Delivery guarantee | Best effort | Best effort | Best effort, with gaps detected and flagged |
| Vended log charge | Yes | No | No |
The gaps that matter:
- No denied traffic. If you rely on REJECT records to see scans or debug security groups, you lose that.
- No east-west visibility. Service-to-service traffic inside the VPC that never goes through an ALB or NAT is invisible.
- No firewall verdicts. Conntrack only sees traffic that has already made it to the NAT. It can’t say whether a security group allowed or blocked something elsewhere.
- Some traffic is excluded, such as connections marked NOTRACK, invalid packets, and anything lost to buffer overflow (which, unlike with flow logs, you at least get told about).
Our compromise: we kept narrowly scoped REJECT-only VPC Flow Logs on our critical security boundaries. Rejected traffic is a tiny fraction of total traffic, so it costs very little, and it closes the biggest gap.
VPC Flow Logs aren’t perfect either. AWS documents skipped records and best-effort delivery for them too. No option here is a truly complete record.
The savings
Prices below use S3 Standard in us-east-1: $0.023 per GB-month and $0.005 per 1,000 PUTs.
ALB logs:
Storage: 4.6 GB/day × 30 days × $0.023         ≈ $3.17/month
Writes:  20 ALBs × 2 nodes × 12 files/hr × 720 ≈ 345,600 PUTs ≈ $1.73/month
Total                                          ≈ $4.90/month
NAT summaries:
Storage is a rounding error (9 MB/day across three NATs is under a cent per month). The number of uploads is what matters:
| Upload pattern | PUTs/month | Cost |
|---|---|---|
| 3 NATs, hourly | 2,160 | ~$0.01 |
| 3 NATs, every minute | 129,600 | ~$0.65 |
| 8 NATs, every minute | 345,600 | ~$1.73 |
Before and after:
| Item | Monthly | Annual |
|---|---|---|
| VPC Flow Logs (before) | ~$10,000 | ~$120,000 |
| ALB + conntrack | ~$10 | ~$120 |
| Savings | ~$9,990 | ~$119,880 |
Estimated monthly and annual costs before and after the change.
Conclusion
We didn’t need flow logs everywhere. Once we looked at what we actually needed to monitor, ALB access logs and conntrack summaries covered most of it at a fraction of the cost.
ALB access logs + conntrack summaries give us low-cost visibility into internet ingress and NAT egress.
This has been enough for troubleshooting, capacity planning, and incident investigations, saving us around $120,000 a year. For compliance and full flow-level forensics, though, it isn’t enough on its own, so we kept REJECT-only flow logs where needed.
Before enabling flow logs everywhere, ask yourself what you actually need them for. You might not need to pay for all that data.