I Rebuilt YouTube's Load Balancing Algorithm in Go
I rebuilt YouTube's load balancing algorithm (Prequal) in Go. It cut p99 tail latency 8.6x vs round-robin. Full walkthrough of the paper, code, and benchmarks.
If you had to guess how a system like YouTube distributes traffic across millions of backend servers, you’d probably default to a classic approach like round-robin load balancing.
But Prequal challenges that intuition. Instead of balancing traffic evenly, it focuses on balancing wait time, routing requests based on how quickly they can actually be served rather than just spreading them uniformly.
According to Google, this approach is already deployed across 20+ services, including YouTube’s serving stack (NSDI ‘24 paper).
Over the past few weeks, I’ve been reimplementing this algorithm in Go partly to understand it deeply, and partly for the bragging rights of building my own load balancer from scratch.
This post is a technical walkthrough of both the paper and codebase:
I believe the most interesting part of this repo is not just that it implements Prequal. It is that the repo preserves the engineering process of getting to a result you can trust. There are wrong runs, methodological mistakes, a regime pivot, overhead profiling, and a final bounded claim rather than a “it worked on my machine”.
Key Takeaways
- Prequal is a load-balancing algorithm Google reports deploying across 20+ services, including YouTube’s serving stack (NSDI ‘24 paper).
- This Go reimplementation, packaged as a Kubernetes ingress controller, cuts
p99tail latency by8.6xvs round-robin in a paper-aligned heterogeneous regime (16 backends, 16x service-time skew, I/O-bound).- In a small CPU-bound regime (4 backends), the same implementation is roughly
25%slower than round-robin. The negative case is published alongside the positive one.- The interesting engineering story is not the algorithm itself. It is the benchmark protocol, investigation trail, and regime pivot that turned a
10x-worse false negative into a bounded, defensible claim.
What problem does Prequal solve?
Prequal, introduced at NSDI ‘24 by Wydrowski et al., replaces CPU-based balancing with active probing of two per-backend signals: requests-in-flight (RIF) and recent latency. A hot-cold lexicographic rule picks the lowest-latency backend below an RIF quantile threshold (default 0.75), falling back to lowest-RIF when every candidate is congested.
Prequal’s central claim, from the paper is that the right signal for load balancing is not CPU utilization but expected wait time, and the paper reports that Google runs this approach across 20+ services including YouTube. The algorithm replaces smoothed load metrics with active probes of requests-in-flight and latency, then uses a hot-cold lexicographic rule on those two signals to pick a backend.
The paper starts from a real production observation inside Google: in large multi-tenant systems, balancing CPU evenly across replicas is not the same thing as minimizing latency. A backend can look “lightly loaded” according to a smoothed resource metric and still be a bad place to send the next request because it is on a noisy host, has a growing queue, or has just crossed into a regime where service time gets ugly.
That is part of what makes the paper compelling. The authors are not proposing a clever synthetic algorithm in the abstract. They are describing the load-balancing approach Google says it uses in production, especially in YouTube’s serving stack, after living with the failure modes of more conventional strategies.
Prequal’s answer is to use two signals:
RIF: requests in flightlatency: a backend-reported estimate of recent service latency
And then to sample those signals by probing backends asynchronously.
The selection rule from the paper is the part worth remembering. Prequal does not combine latency and RIF into one score by default. It uses a lexicographic rule:
- Split candidates into “cold” and “hot” using an RIF quantile threshold.
- If any cold candidates exist, pick the one with the lowest latency.
- If every candidate is hot, pick the one with the lowest RIF.
That rule matters because it captures something simple and useful:
- latency is the best tie-breaker among backends that are not yet visibly congested
- once everything is congested, queue depth wins and you should pick the least loaded one
The paper calls this the hot-cold lexicographic rule, or HCL. In this repo, that is the heart of the algorithm.
If you have read about the power of two choices algorithm before, Prequal lives in the same family. Power of two picks two random backends and sends the request to whichever has fewer in-flight connections. It is cheap, surprisingly close to optimal, and widely deployed. HAProxy’s own benchmark (Power of Two Load Balancing) shows it beating round-robin on peak connection skew but still losing a few percent to a full least-connections scan. Prequal generalizes the idea: instead of two random picks checked synchronously, it keeps a small pool of asynchronous probe results and selects from that pool using both RIF and latency, not just connection count.
The other big paper idea is async probing. Synchronous probing would put an extra network hop in the critical path of every request. Prequal instead probes off the request path, stores recent probe observations in a bounded pool, and reuses them enough to be cheap without letting them go stale.
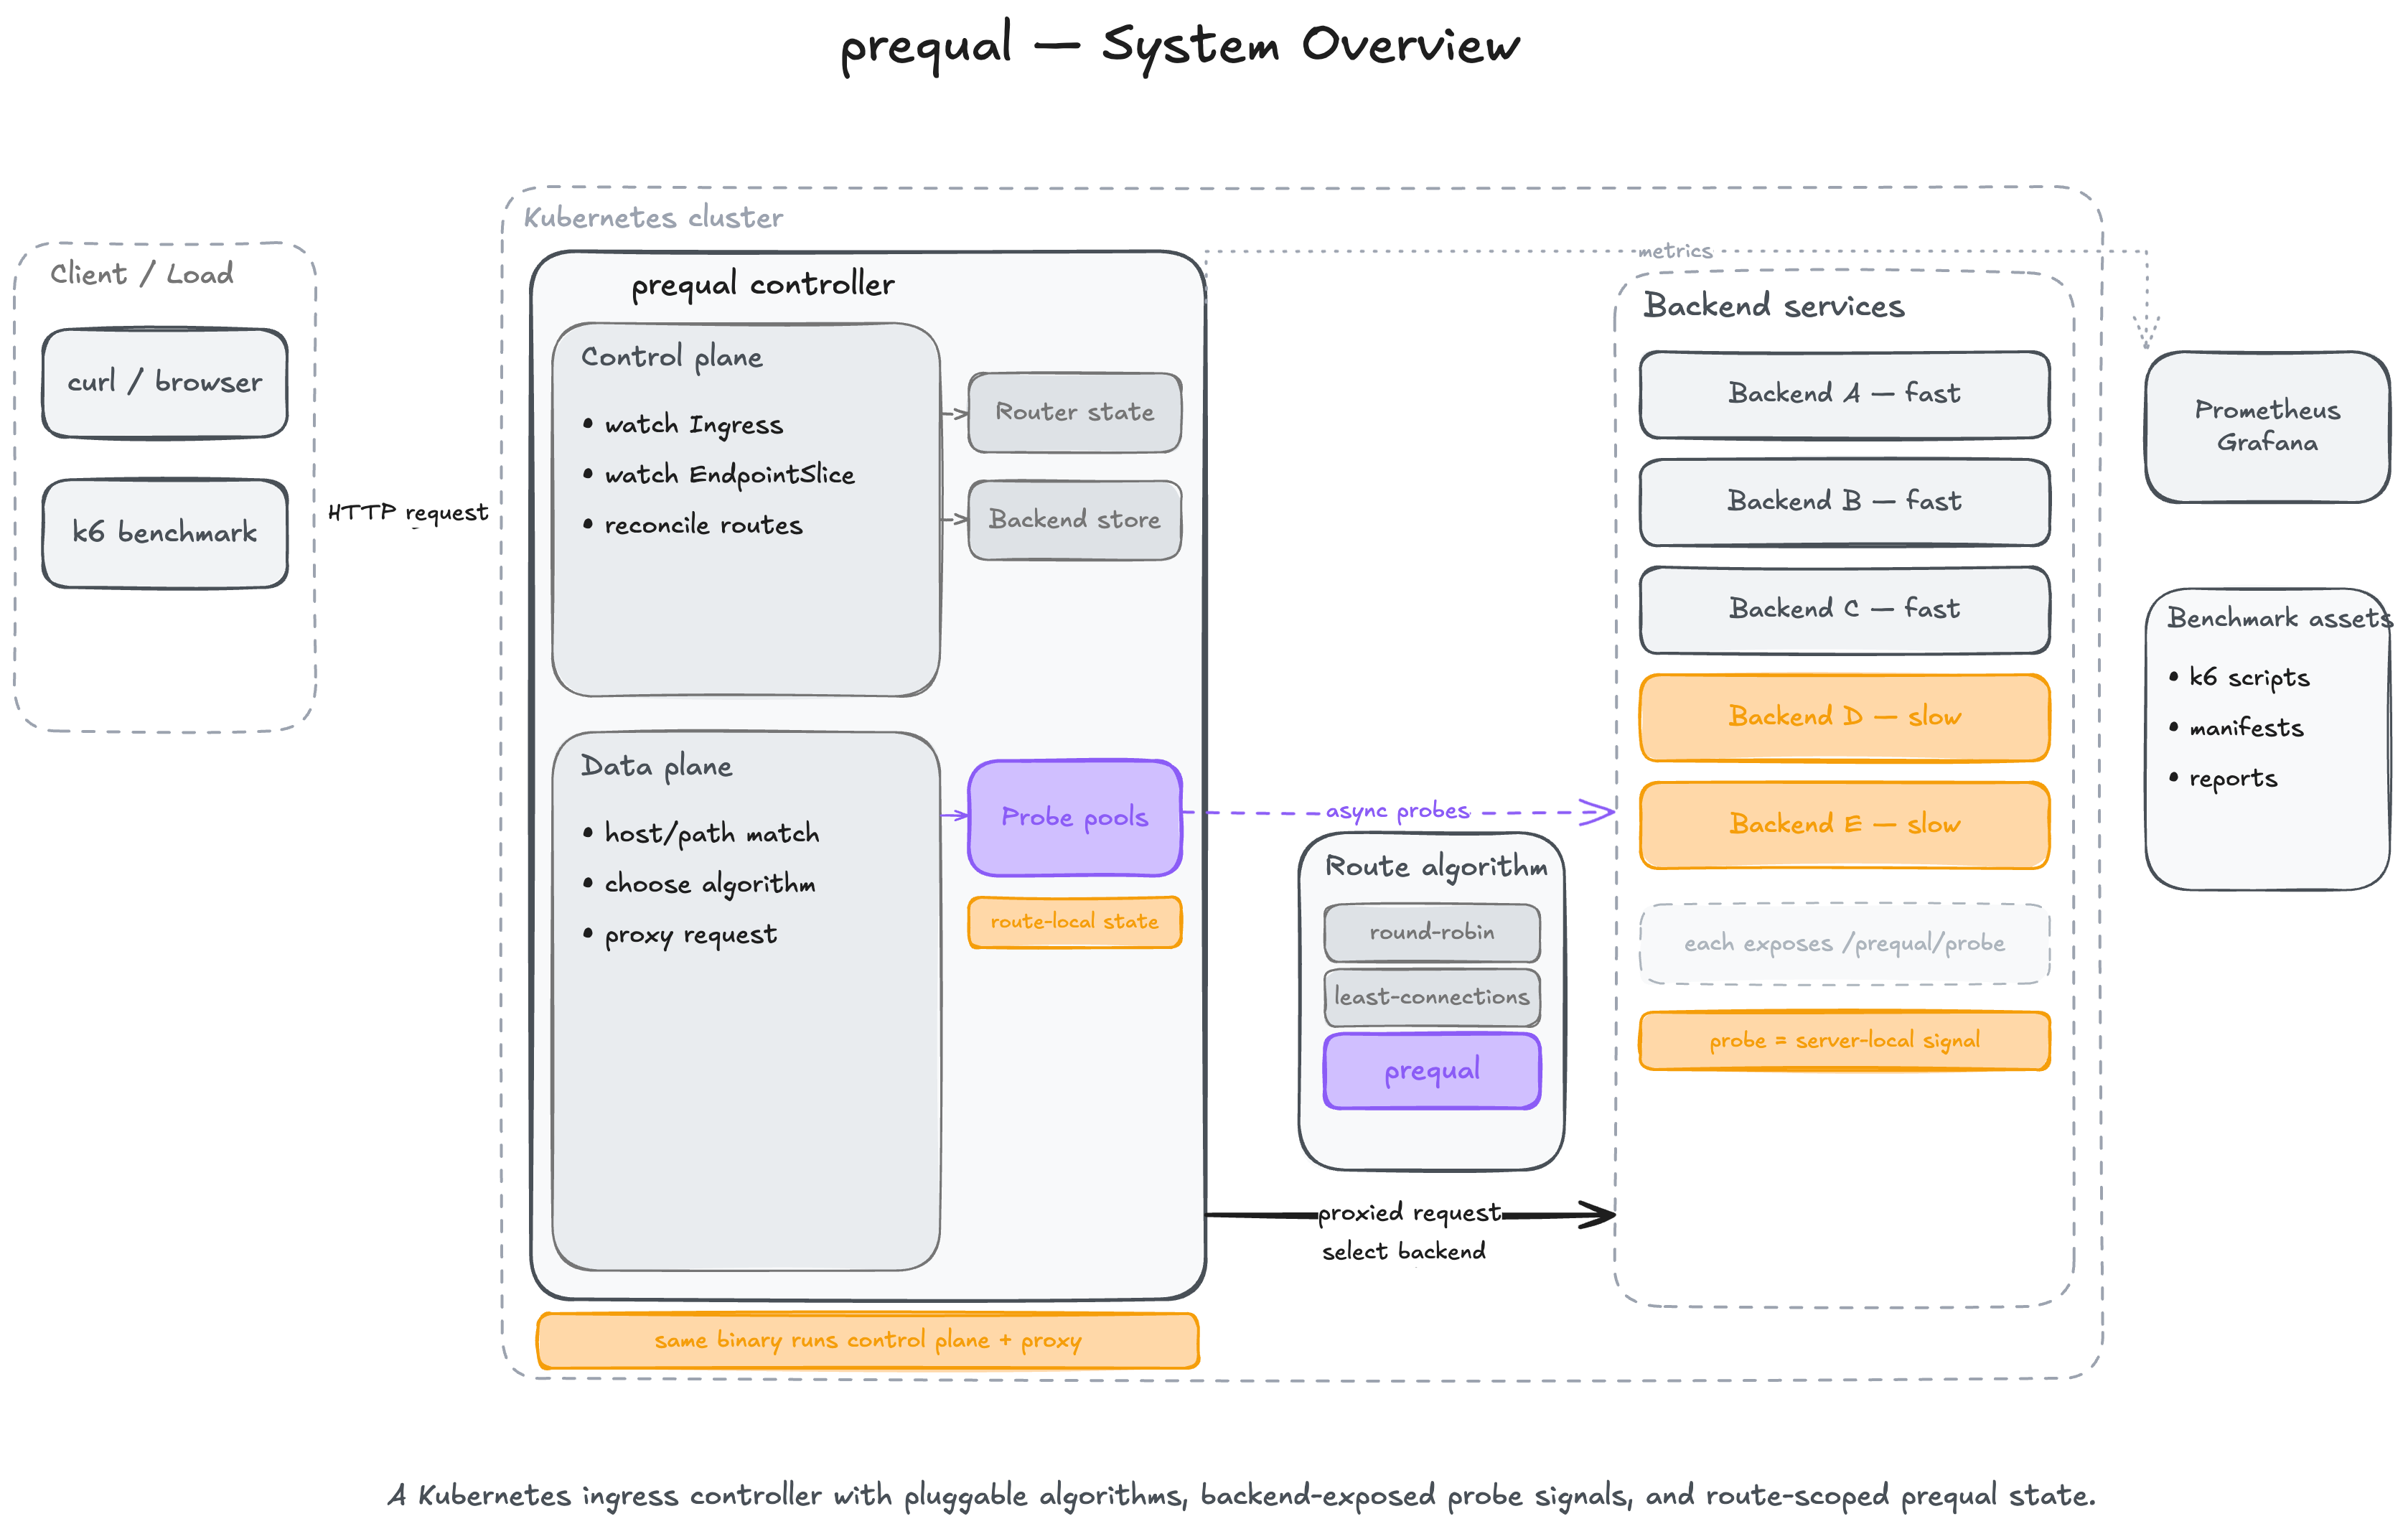
What I’ve actually built
At runtime this project is one Go binary with two jobs:
- a Kubernetes controller that watches
IngressandEndpointSlice - an HTTP reverse proxy that receives requests and selects backends
Around that, the repo includes:
- a Rust backend used for controlled benchmarks
- benchmark manifests for uniform and heterogeneous workloads
k6scripts for open-loop, ramp, burst, overload, multi-route, and long-duration tests- Prometheus and Grafana assets
- frozen benchmark reports and investigation logs
The top-level structure is clean and maps well to the architecture:
controller/      Kubernetes reconciliation and route state
server/          Reverse proxy and request-path selection
loadbalancer/    Prequal, least-connections, round-robin, probe logic, RIF, latency, pools
backend/         Rust benchmark backend exposing /work and /prequal/probe
observability/   Prometheus metrics
tree/            Host/path trie for ingress routing
benchmark/       Manifests, k6 scripts, dashboards, reports, investigations, raw results
The entrypoint in main.go wires all of that together:
store := controller.NewBackendIPStore()
ctrl := controller.NewController(factory, store, queue)

tracker := &loadbalancer.RIFTracker{}
latencyTracker := loadbalancer.NewLatencyTracker()

cfg := loadbalancer.DefaultProbeConfig()
cfg.ApplyEnv()

pools := pool.NewRoutePools(pool.PoolConfig{
    MaxSize:     cfg.PoolMaxSize,
    MaxAge:      cfg.PoolMaxAge,
    ReuseLimit:  cfg.PoolReuseLimit,
    QRIF:        cfg.QRIF,
    MaxProbeAge: cfg.MaxProbeAge,
}, cfg.PoolMaintenanceInterval)

prober := loadbalancer.NewProber(pools, store, cfg, stop)
proxyServer := server.NewProxyServerWithConfig(
    ctrl.GetRouter(), store, selectors, tracker, latencyTracker, pools, prober, serverCfg,
)
That composition is the design of the loadbalancer:
- the controller owns route and endpoint discovery
- the proxy owns request forwarding
- the load balancer owns route-local state and selection policy
Control plane: translating Kubernetes into route state
The control plane lives in controller/. It uses shared informers to watch Ingress and EndpointSlice, then builds two in-memory structures:
- a host/path router
- a route-key to endpoint list store
The important point is that the controller does not directly configure nginx or write files. It builds local state for the in-process proxy.
Watching ingress and endpoints
controller.NewController registers event handlers for both resource types:
- ingress add, update, delete
- endpointslice add, update, delete
On an ingress event, the controller queues the ingress key for reconciliation. On an endpoint event, it finds which ingresses depend on the service and requeues those.
That dependency mapping is stored in serviceToIngress, which is what lets endpoint churn trigger only the routes that care about it.
The ingress reconciliation path in controller/controller.go does four things:
- filters to this controller’s class
- parses rules into route specs
- updates the router
- refreshes the endpoint store for each referenced service/port
The filtering logic accepts:
spec.ingressClassName == "prequal"- legacy
kubernetes.io/ingress.class: prequal - a fallback label
ingress.class=prequal
Route matching with a trie
The router in controller/router.go delegates path matching to tree/, which implements a segment trie. Each host gets a HostConfig with a list of paths plus a trie built from those paths.
tree.Match supports:
- exact paths
- prefix paths
- longest-prefix semantics
- default-host fallback when a specific host is missing
That means route resolution is:
- match host
- walk the trie by URL segments
- prefer exact matches, otherwise keep the best prefix match
Kubernetes objects are converted once into RouteSpec, and the request path never has to understand Kubernetes types.
Endpoint storage is route-local
The controller stores endpoints in BackendIPStore, keyed by a route key derived from namespace, service, and port:
namespace/servicenamespace/service:portnamespace/service:portName
That matters because the load-balancing state is also route-local. If two ingress routes point at different services, their probe history does not mix. If two routes point at the same service but different ports, their state stays separate too.
Dataplane: the reverse proxy request path
The dataplane lives in server/server.go. This is where a request enters the proxy, gets matched to a route, resolves candidate backends, triggers async probes, selects one backend, and is forwarded with httputil.ReverseProxy. For the full upstream context of how a request reaches this point (DNS, service mesh, kube-proxy, endpoints), see my earlier walkthrough on the request flow from a user to a Kubernetes pod.
The flow is:
- normalize host
- match route from the trie
- fetch candidate backends from the endpoint store
- trigger async probes for that route
- pick a backend using the requested algorithm
- increment RIF counters
- proxy the request
- record observed latency locally
That is all in one request handler, which makes the architecture easy to follow.

The selection branch is especially important:
func (p *ProxyServer) selectBackend(routeKey, algo string, backends []*controller.Endpoint) (*controller.Endpoint, error) {
    switch algo {
    case "prequal", "":
        entry, err := p.pools.Select(routeKey, backends)
        if err != nil {
            return nil, err
        }
        p.pools.IncrementRIF(routeKey, entry.Backend)
        return entry.Endpoint, nil
    default:
        sel, exists := p.selectors[algo]
        if !exists {
            return p.selectBackend(routeKey, "prequal", backends)
        }
        return sel.Select(backends)
    }
}
A few design choices here that i’ve made are:
First, Prequal is the default. If the ingress annotation lb/algo is empty, the proxy uses Prequal.
Second, round-robin algo has been included as well.
This makes the benchmark harness clean. The same controller, proxy, transport, and backend stack can be benchmarked with different selection rules by patching one ingress annotation.
Third, the proxy increments both a global RIF tracker and the selected pool entry’s RIF view. That keeps the request path’s immediate state and the pool’s sampled state reasonably aligned.
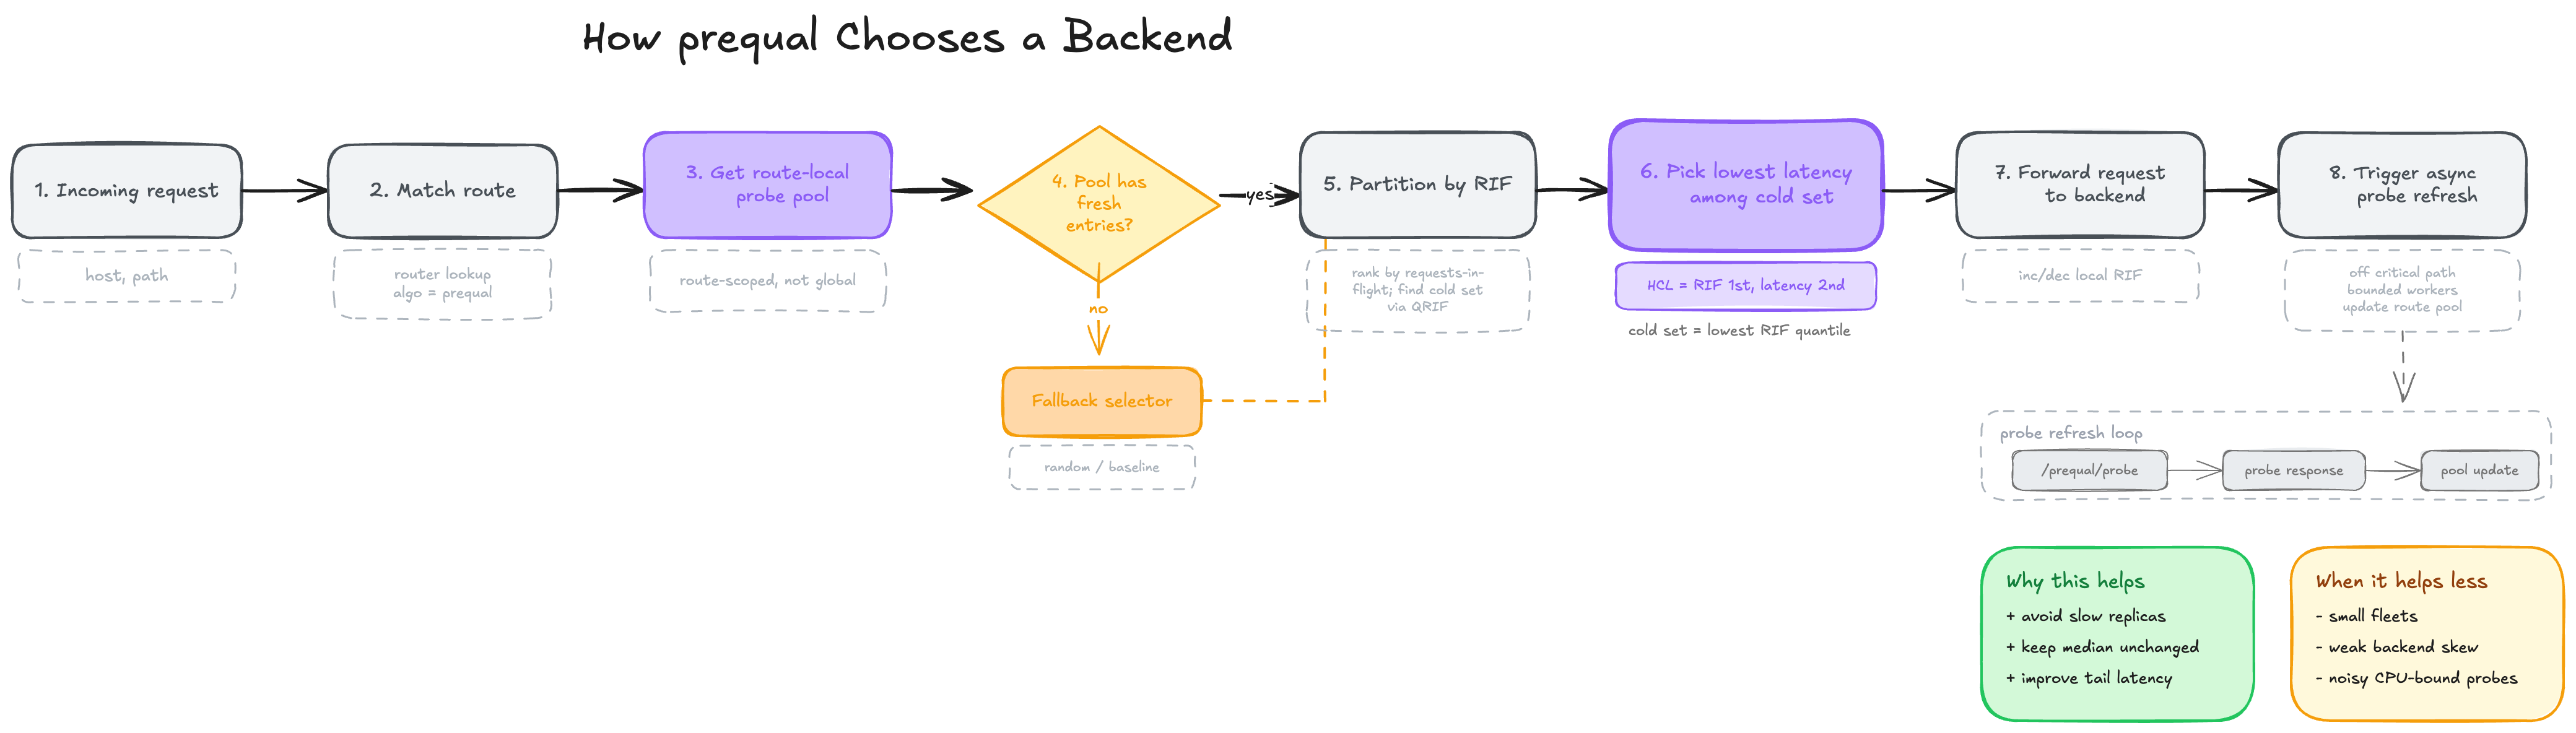
How is Prequal implemented in Go?
The implementation is split across:
loadbalancer/prober.goloadbalancer/pool/pool.goloadbalancer/pool/pools.goloadbalancer/rif.goloadbalancer/latency.goloadbalancer/config.go
This is the core of the repo.
Route-local probe pools
The paper’s async probing design only works if sampled state is bounded and per-route. That is what RoutePools does: it owns one ProbePool per route key.
Each ProbeEntry holds:
- backend address
- endpoint pointer
- RIF
- latency
- probe timestamp
UsesLeft
UsesLeft is the local implementation of probe reuse. A probe can be selected a limited number of times before it is evicted.
The pool is bounded by both size and age:
MaxSizeMaxAgeMaxProbeAge
That gives the lb three protection mechanisms against stale decisions:
- cap how many probe samples are retained
- remove entries that are too old in wall-clock terms
- remove entries once they have been reused enough

HCL in code
The HCL selection rule is implemented directly in loadbalancer/pool/pool.go. This is the most important code in the project.
The key selection logic looks like this:
threshold := rifs[idx]

var bestCold *ProbeEntry
var bestHot *ProbeEntry
allHot := true

for i, e := range pool.entries {
    if e.RIF <= threshold {
        allHot = false
        if bestCold == nil || e.Latency < bestCold.Latency {
            bestCold = e
            bestColdIndex = i
        }
        continue
    }
    if bestHot == nil || e.RIF < bestHot.RIF {
        bestHot = e
        bestHotIndex = i
    }
}

selected := bestCold
if allHot {
    selected = bestHot
}
That is a direct implementation of the paper’s idea:
- compute the RIF quantile threshold
- treat
RIF <= thresholdas cold - among cold entries, minimize latency
- if nothing is cold, minimize RIF
It is not trying to be clever, which I think is the right call here. Algorithm code gets dangerous when it becomes hard to explain. This one stays direct.
The fallback behavior is also worth noting. If the pool has fewer than two entries, the code falls back to a random backend from the full backend list. That is how the system behaves before warmup or after starvation:
if len(pool.entries) < 2 {
    ep := allBackends[rand.Intn(len(allBackends))]
    return &ProbeEntry{Backend: ep.String(), Endpoint: ep}, len(pool.entries), nil
}
The benchmark campaign explicitly tracks how often that fallback happens. In the decisive Prequal runs, it is zero, which matters because otherwise a “Prequal win” might secretly be a random-selection run.
Async probing
loadbalancer.Prober is the other half of the design. It is responsible for:
- sending HTTP probes to
/prequal/probe - decoding backend-reported RIF and latency
- rejecting stale probe responses
- feeding entries into the route-local pool
- keeping pools warm in the background
The request path never blocks on probe completion. Instead, TriggerProbes(routeKey) enqueues work:
func (pr *Prober) TriggerProbes(routeKey string) {
    if routeKey == "" {
        return
    }
    n := pr.probesForQuery()
    for i := 0; i < n; i++ {
        pr.enqueueProbe(routeKey)
    }
}
Workers consume those route keys, sample a backend for the route, call the probe endpoint, and add a ProbeEntry to the right pool.
The configuration lives in loadbalancer/config.go, and the defaults are important because they define the repo’s behavior:
- pool size:
16 - pool max age:
1s - reuse limit:
3 QRIF:0.75- probes per query:
1.0 - probe workers:
8 - background interval:
100ms - probe timeout:
100ms - max probe age:
2s
Those values are not arbitrary, but they are also not identical to the paper’s defaults. More on this later
RIF and latency tracking
Besides backend-reported probe data, the proxy maintains its own local trackers:
RIFTrackerusessync.Mapandatomic.Int64LatencyTrackerkeeps a per-backend circular buffer and reports a local median
These are used for two things:
- supporting least-connections
- optionally seeding the probe pool when the async prober is disabled
The pool can be bootstrap-seeded from local observations if the async prober is absent, but once the prober exists, backend probes become the authoritative source.
The benchmark backend
The Rust backend in backend/src/main.rs is part of the implementation model.
It exposes three endpoints:
POST /workGET /healthGET /prequal/probe
/work simulates the backend’s actual service time.
/prequal/probe exposes the two signals Prequal needs.
The backend’s internal state is visible in exactly the way the algorithm expects. Which makes controlled experiments possible at all.
Work mode: CPU-bound or I/O-bound
The backend has two modes:
- CPU-bound SHA256 loop
- I/O-bound sleep mode
That switch is controlled by IO_BOUND_MODE.
In CPU-bound mode, each request burns CPU with repeated hashing.
In I/O-bound mode, each request sleeps for iterations * IO_BOUND_BASE_US.
That one switch ends up being central to the benchmark story. On small CPU-bound fleets, Prequal loses. In the paper-aligned I/O-bound skewed regime, it wins decisively.
Probe responses are RIF-conditioned
The backend tracks current RIF with an atomic counter and stores recent latency samples in five buckets:
012..34..78+
The probe handler looks at the current RIF, chooses the matching bucket, and returns the median latency from that bucket or the nearest non-empty bucket.
This means the probe latency signal is not a raw median across all recent requests. It is conditioned on queue depth.
The probe response shape is simple:
{
  "rif": 3,
  "latency_median_ms": 12.5,
  "timestamp_ms": 1710000000000
}
The Go prober then turns that into a ProbeEntry, rejects it if the timestamp is too stale, and inserts it into the right pool.
Fault injection is built in
The backend also supports probe-fault modes:
- timeout
- HTTP 500
- malformed JSON
- stale timestamp
This makes it possible to test whether the prober correctly records failures, drops bad data, and avoids poisoning the pool with stale observations.
The observability path
The controller and proxy expose Prometheus metrics for request latency, per-algorithm selections, probe success and failure counts, probe queue depth, pool occupancy, and active backend count. A debug server exposes
/metrics,/routes,/healthz,/readyz, andpprofendpoints. That is enough to explain benchmark results, not just report them.
This repo instruments the controller and proxy heavily enough that you can explain a benchmark result rather than just report it.
The Prometheus metrics in observability/metrics.go cover:
- total requests and request latency
- backend selections by route and algorithm
- no-route and no-backend events
- reconciliation counts and durations
- probes sent, succeeded, failed, dropped
- probe queue depth
- pool occupancy
- selection algorithm usage
- active backend count
And the debug server in debug.go exposes:
/metrics/routes/healthz/readyzpprofendpoints
That instrumentation is what makes the benchmark investigation credible. The repo can answer questions like:
- Did Prequal actually avoid the slow replicas?
- Was the pool starving?
- Were requests falling back to random?
- Was the controller CPU-bound?
- Was mutex contention the problem?
The observability here is how the benchmark results got debugged, not dashboard decoration.
Benchmarking
A controlled protocol (interleaved algorithm order, controller rollout-restart per run, warmup period, full metadata capture) turned an early 10x-worse false negative into a reproducible 8.6x p99 improvement. The methodology fix alone, with zero algorithm code changed, produced a 56x p99 reduction in the heterogeneous run.
The benchmark harness in benchmark/ is extensive enough that it deserves to be treated as part of the software, not just support files.
There are several traffic models:
steady_state.jsopen_loop.jsrate_ramp.jsburst.jsoverload.jslong_duration.jsmulti_route.js
And there are matching manifests for:
- uniform workloads
- heterogeneous workloads
- multi-route workloads
- route-scale
- long-duration
- fault injection
The comparisons are made by holding everything constant except the algorithm annotation on the ingress.
That gives a fair comparison:
- same controller binary
- same route matching
- same transport
- same backend images
- same cluster
- same load script
- same observability stack
Only the backend selection rule changes.
The controlled protocol
The methodology fix alone, with zero algorithm code changed, produced a 56x p99 reduction in the E-B heterogeneous run. The seven competing hypotheses are walked in here
An early heterogeneous run made Prequal look dramatically worse than the baselines, but it turned out the main problem was protocol:
- algorithms were run sequentially instead of interleaved
- controller state leaked across runs
- probe pools were not reset cleanly between repetitions
The fix became the canonical benchmark protocol:
- interleaved algorithm order
- controller rollout restart before every run
- warmup period before measurement
- full metadata capture per run
That protocol is encoded in benchmark/scripts/run_interleaved_campaign.sh and benchmark/scripts/run_campaign.sh.
Why open-loop matters
The decisive C2 benchmark uses k6 constant-arrival-rate mode:
export const options = {
  scenarios: {
    open_loop: {
      executor: 'constant-arrival-rate',
      rate,
      timeUnit: '1s',
      duration,
      preAllocatedVUs,
      maxVUs,
    },
  },
}
This is a better choice than closed-loop when the point is to expose queueing behavior. Closed-loop traffic self-throttles when latency rises. Open-loop keeps pushing at the target rate and makes tail failures visible.
The ramp benchmark does the complementary thing: it increases arrival rate in stages until the system crosses its comfortable regime.
Together, those two tests are enough to answer the important question: does Prequal help under skew and near saturation, which is exactly where the paper says it should?
How much faster is Prequal than round-robin?
On a 16-backend cluster with 16x service-time skew (I/O-bound, open-loop), this Go Prequal implementation cut p99 tail latency by 8.6x versus round-robin and 8.5x versus least-connections. On a 4-backend CPU-bound cluster, the same implementation was roughly 25% slower than round-robin on throughput. Prequal is a tail-latency tool, not a small-fleet tool.
Across five-run interleaved campaigns on a 16-backend cluster with 16x service-time skew, this Prequal implementation cut p99 tail latency by 8.6x against round-robin and 8.5x against least-connections on an open-loop workload, and by 6.8x against round-robin on a rate ramp. On a small 4-backend CPU-bound workload, the same implementation was roughly 25% slower than round-robin on throughput. The repo’s final claim is deliberately bounded, and I think it is the right one.
Small CPU-bound fleet: Prequal loses
In the small-fleet CPU-bound regime, this implementation does not win.
The report’s C1 numbers are:
| algorithm | throughput rps | p99 ms |
|---|---|---|
| prequal | 4162 | 29.86 |
| round-robin | 5366 | 20.22 |
| least-connections | 4965 | 23.48 |
That is roughly a 25% throughput deficit versus round-robin.
I profiled it and the overhead investigation concludes that:
- there is no hot path dominating controller CPU
- mutex contention is negligible
- heap use is tiny
- the measurable cost is mostly diffuse probe/network competition in a regime where the algorithm does not have enough diversity or skew to pay for itself
Paper-aligned skewed I/O-bound regime: Prequal wins hard
The story changes once the benchmark is moved closer to the paper’s assumptions:
- 16 backends instead of 4
- 14 fast, 2 slow
- 16x service-time skew
- I/O-bound backend mode
- open-loop and ramp traffic
In the E-B heterogeneous open-loop campaign, the median p99 numbers are:
| algorithm | p99 ms | p99.9 ms |
|---|---|---|
| prequal | 94.20 | 272.38 |
| round-robin | 807.32 | 887.90 |
| least-connections | 802.84 | 1006.78 |
That is an 8.6x p99 improvement versus the best baseline.
In the E-B ramp campaign:
| algorithm | p99 ms | p99.9 ms |
|---|---|---|
| prequal | 123.39 | 824.08 |
| round-robin | 831.58 | 1250.41 |
| least-connections | 867.93 | 1596.51 |
That is still a 6.8x p99 improvement.
The selection-rate data explains why. Prequal pushes traffic almost entirely to the fast backends and drives the two slow replicas down to nearly zero selections per second. Round-robin, by definition, keeps giving the slow pair their fair share. Least-connections improves the p95, but still reacts too slowly to avoid queueing at the slow replicas, so the tail remains pinned near their service time.
This mechanism lines up with the result
The win is in the tail, not the center
One subtle but important point from the data is that p50 is basically the same across algorithms in the winning regime. The advantage is almost entirely in p99 and p99.9.
That is exactly what you would expect if the algorithm is avoiding pathological queueing rather than making the median request faster.
It is also why Prequal is interesting. If your median is already fine, the only remaining reason to build a more sophisticated load balancer is to keep a minority of requests from getting stuck behind bad backend choices.
How faithful is this Go implementation to the Prequal paper?
This Go implementation defaults to
Q_RIF = 0.75versus the paper’s 0.84,probes-per-query = 1.0versus the paper’s 3 (testbed) and 5 (YouTube production), and hardcodes probe reuse at 3 rather than deriving it from pool size and fleet size. The frozen benchmark report documents every divergence explicitly.
This repo is faithful to the paper’s central ideas, but it is not a line-by-line reproduction. The frozen report documents the differences clearly, and they matter.
The most important divergences are:
QRIF default is 0.75, not the paper’s ~0.84
The paper’s baseline uses Q_RIF = 2^(-0.25) ≈ 0.84.
This repo defaults to 0.75.
That is within the paper’s recommended band and probably a minor difference, but it is still a difference.
Probes per query is 1.0, not 3 or 5
The paper uses 3 probes per query in testbed experiments and mentions 5 in YouTube production.
This repo defaults to 1.0.
That choice was motivated by keeping probe overhead reasonable on a small local cluster, but it is a substantial departure.
Probe reuse is a fixed constant
The paper derives reuse behavior from a formula involving pool size, fleet size, probe rate, and removal rate.
This repo hardcodes PoolReuseLimit = 3.
That is a reasonable engineering choice for a local implementation, but it means the repo is approximating one part of the paper’s mechanics rather than reproducing it exactly.
Probe removal is maintenance-driven
The paper frames removal as a per-query process. This repo performs cleanup and “remove worst” behavior on a maintenance tick plus reuse depletion.
That keeps work off the request hot path, which is sensible for Go code in a proxy, but it is another behavioral difference.
Backend probing is not yet sampling without replacement
The report points out a latent issue: ProbeRandom picks one backend at a time with rand.Intn, so if probes-per-query were raised above 1, the implementation would not yet match the paper’s “sample without replacement” requirement.
Final thoughts
Writing this was a lot of fun—and watching Claude run tests and benchmarks made it even better. There were a couple of ideas I wanted to explore further but didn’t get to, mainly because I was short on time and wanted to move on to the next project.
One idea was to build a sidecar container or probe that uses eBPF to attach to the main backend container, collect both latency and RIF, and expose that data through a path that the ingress controller could use to make smarter routing decisions. Another was to design a centralized probe pool that multiple ingress controller pods could read from, or to implement a gossip protocol between controller pods to share this information in a decentralized way.
But eventually, it was time to move on. As always, the next project always tends to pull more than the last.
Until next time.
References
- Wydrowski, Kleinberg, Rumble, Archer. Load is not what you should balance: Introducing Prequal, NSDI 2024.
- Repo benchmark report:
benchmark/REPORT.md - Tail-spike investigation:
benchmark/investigations/2026-04-19-c2-tail-spike.md - Regime pivot investigation:
benchmark/investigations/2026-04-20-regime-pivot.md - Overhead profiling investigation:
benchmark/investigations/2026-04-20-prequal-overhead-profiling.md - HAProxy Technologies. Power of Two Load Balancing — context for why Prequal’s quantile-over-pool design is a more sophisticated variant of the same “sample a subset, don’t score every backend” idea.
- Full source code: github.com/sathwick-p/prequal — the controller, reverse proxy, Rust benchmark backend, k6 scripts, Prometheus/Grafana assets, and frozen benchmark reports all live here.