Inside the Kubernetes Observability Pipeline: Logs, Events, and Metrics
A technical walkthrough of how Kubernetes logs, Events, and metrics move from their sources through collectors, processors, and backend storage.
When you look at a Kubernetes dashboard, it is easy to think that logs, metrics, and Events simply flow from the cluster into the observability backend. In reality, each signal takes a very different path before it becomes something you can query or visualize. A container log may start as stdout or stderr, get written to a file on the node, picked up by an agent, parsed, enriched with Kubernetes metadata, passed through one or more collectors, batched, and finally exported to a backend. Kubernetes Events originate as API objects and are collected through the Kubernetes API. Metrics can come from Prometheus-style scraping, Kubernetes object state, node or application exporters, or directly through OTLP. Understanding these paths matters because every stage introduces its own failure boundary. A missing log does not necessarily mean the application never produced it. A metric disappearing from a dashboard does not always mean the service stopped exposing it. The data may have been dropped, misidentified, delayed, or transformed somewhere along the way. This article follows logs, Events, and metrics through that pipeline from their source inside Kubernetes to the observability backend. We will look at how they are collected, parsed, enriched, processed, batched, exported, and validated, and where things can go wrong at each step. There are a few different collectors in this setup. Each has a specific responsibility. Let’s start with that split so that the individual pipelines are easier to follow.
Scope and version baseline
BYOC means Bring Your Own Cloud. In Groundcover’s BYOC setup, the data backend runs in your cloud environment. It can live in a dedicated cluster and receive telemetry from several monitored clusters. Sending data out of a monitored cluster does not necessarily mean sending it out of your cloud account. See Groundcover’s architecture.
This is a walkthrough of the historical architecture labeled v0.2.44 in the original deployment notes. Its component versions are:
| Component | Version in the historical setup |
|---|---|
| Custom BYOC chart | v0.2.44 |
| OpenTelemetry Collector | 0.110.0 |
| OpenTelemetry Collector Helm chart | 0.108.0 |
| Fluent Bit | 3.1.9 |
These are the versions being explained, not a recommendation to use old images for a new installation. OpenTelemetry is shortened to OTel below. OTLP is the OpenTelemetry Protocol used to send telemetry between applications, collectors, and backends.
The custom chart source and generated manifests are not available alongside this article. The role split below describes the intended architecture. Where exact behavior depends on a custom helper, we will call that out. Upstream behavior is linked to the relevant version where possible.
The configuration examples use observability as the namespace, rnd-cluster as the cluster name, and development as the environment. Corrected examples are teaching configurations, not a claim that the historical chart rendered those exact files. The appendix separates complete component configurations from fragments that need to be combined with your deployment configuration.
This walkthrough covers container stdout/stderr logs, Kubernetes Events, and metrics. It does not configure native OTLP application logs or traces. Declaring an OTLP receiver in a shared configuration does not enable every signal; the rendered service.pipelines configuration decides what actually runs.
Architecture overview
Each monitored cluster runs its own collection components. Those components can send to the same Groundcover backend while attaching their own cluster and environment identity.
The main paths look like this. Arrows show the direction of telemetry; Prometheus scrape requests travel in the opposite direction to the returned metrics.
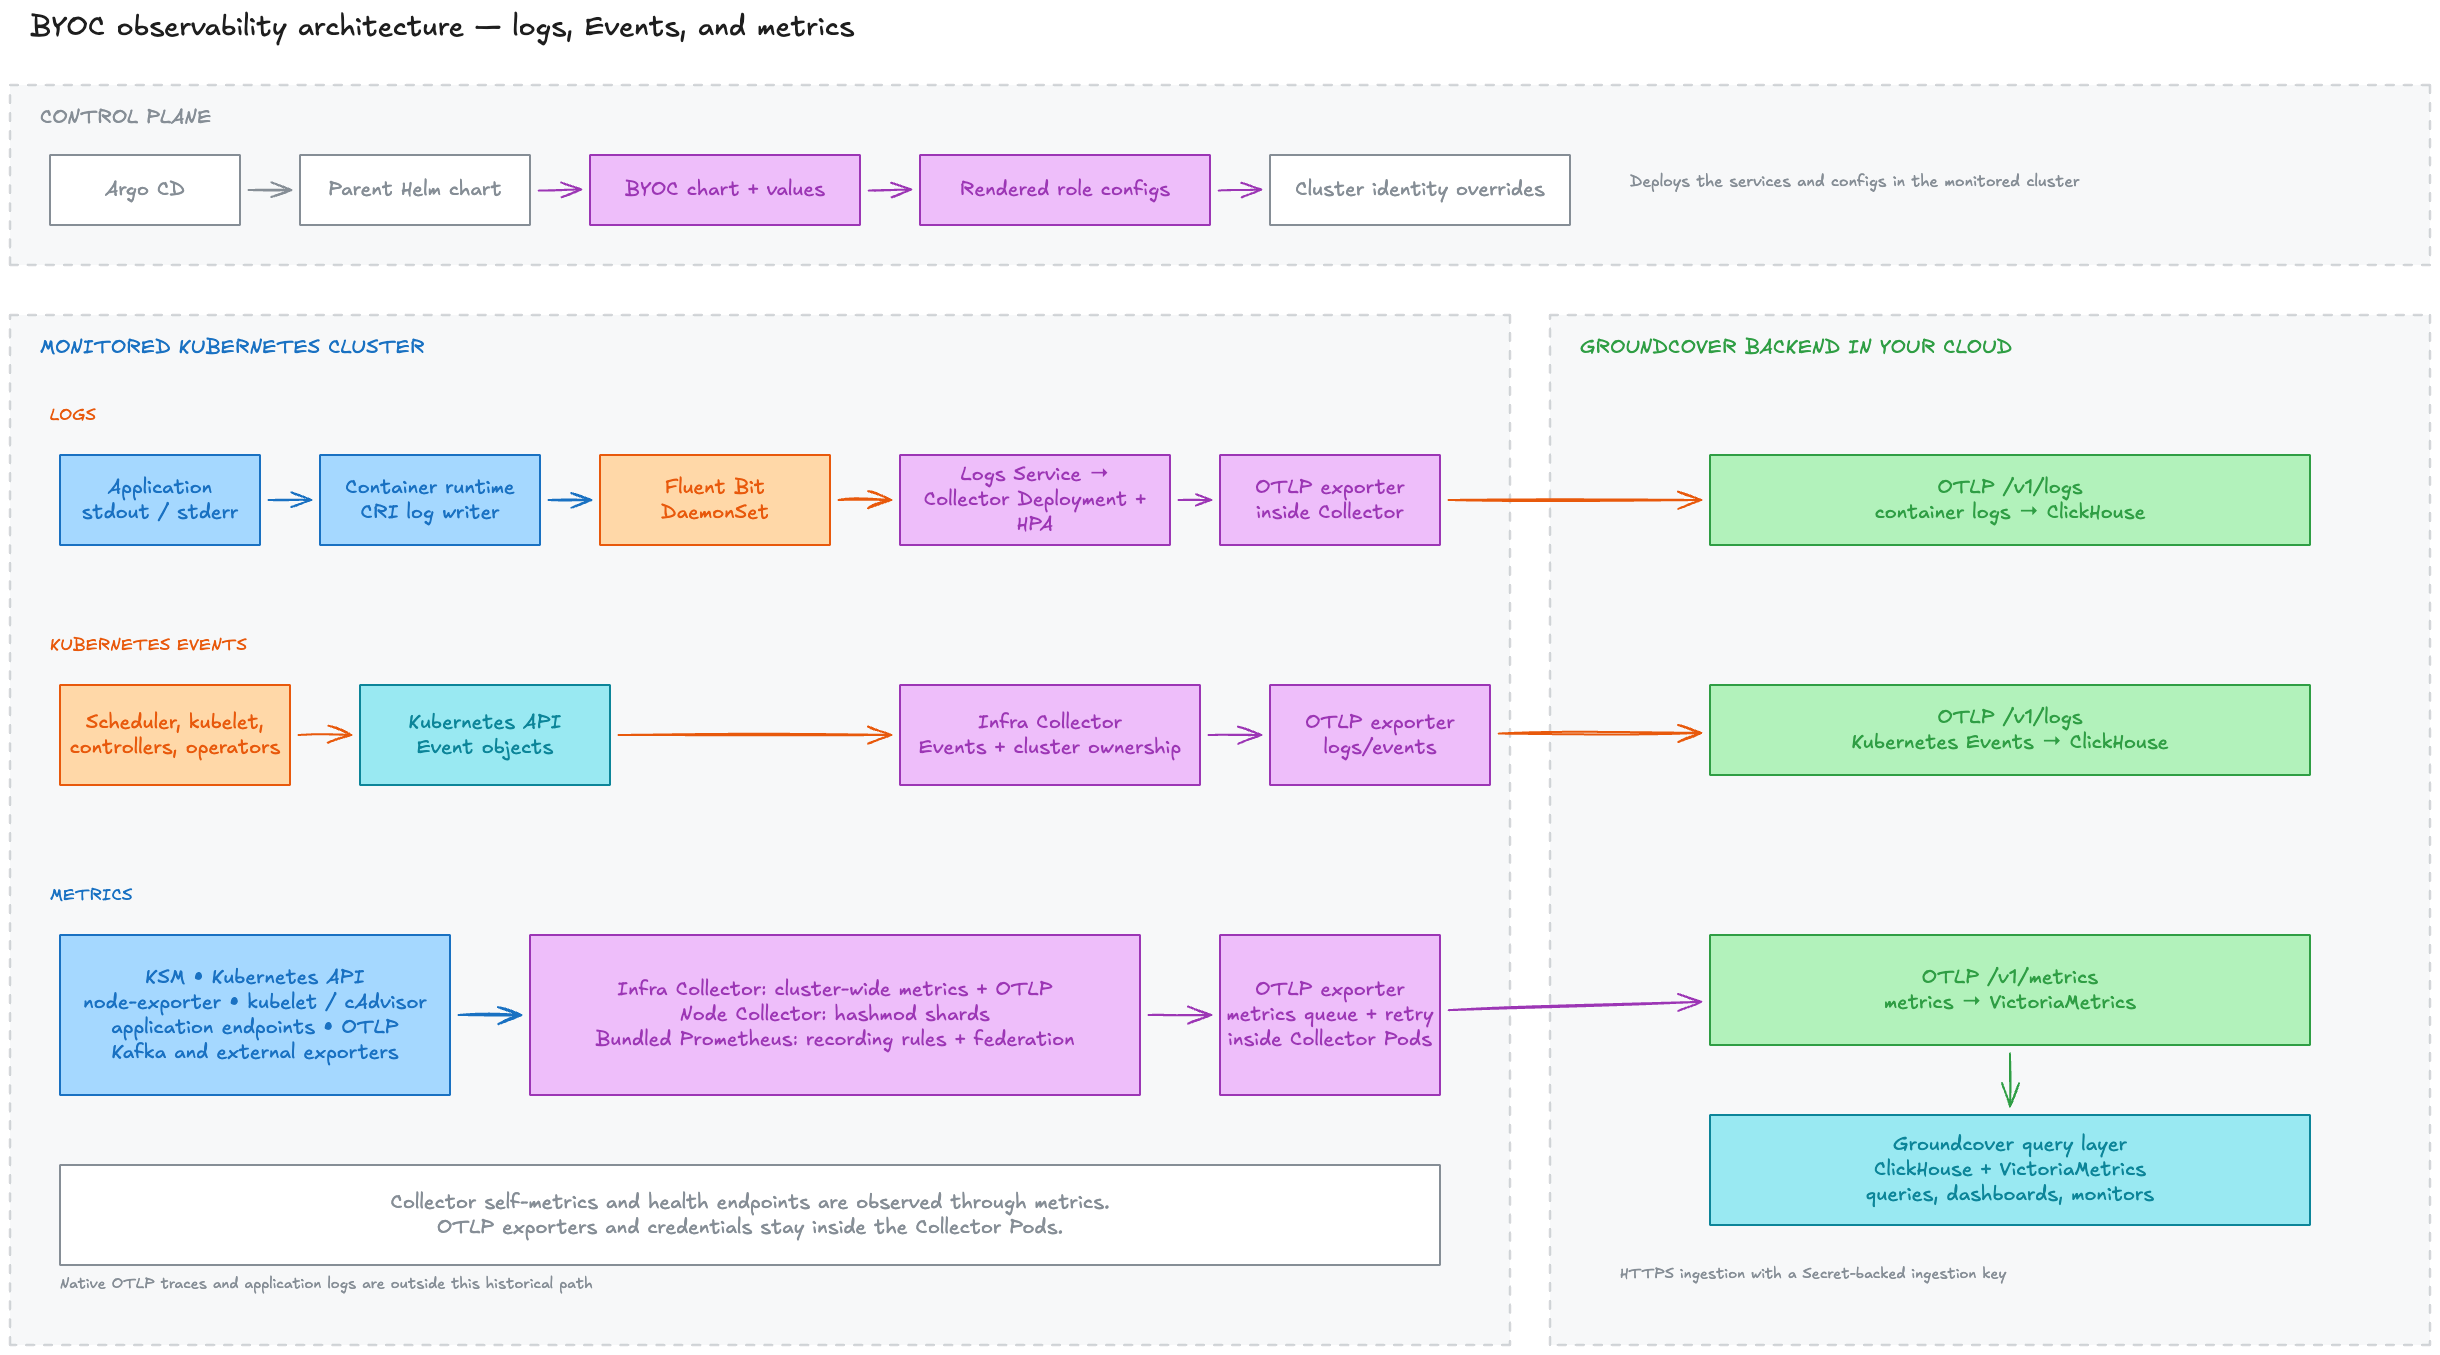
Figure: the control-plane rendering path, monitored-cluster collectors, telemetry lanes, and Groundcover storage boundary.
The OTLP exporters and their credentials belong inside the Collector Pods in the monitored cluster. They are the clients sending requests to Groundcover.
Kubernetes objects versus Collector components
A Deployment or StatefulSet manages Pods. A Service provides network access to selected Pods. Inside each Collector Pod, the Collector process loads a configuration and starts its receivers, processors, exporters, and extensions.
The internal path is:
receiver → configured processors → batch processor → exporter queue → HTTP client
These are components inside the same process. They do not need a separate Pod or Service for each stage. A processor name such as transform/fluent_source_identity means an instance of the transform processor named fluent_source_identity; it is not a separate built-in identity service.
The same distinction matters for the Prometheus receiver. It embeds scraping functionality inside OTel. Bundled Prometheus is a separate server with its own scraping, storage, and rule evaluation.
Collector roles and signal ownership
The historical setup uses a dedicated logs role when global.collectorSplit.logsSplit.enabled is true. That is the path we will follow.
| Component | Deployment model | Responsibility | Next destination |
|---|---|---|---|
| Fluent Bit | DaemonSet | Read container log files on each eligible node | Logs Collector Service |
| Logs Collector | Deployment, with an intended Horizontal Pod Autoscaler (HPA) | Receive Fluent Forward logs and reconstruct source identity | Groundcover |
| Infra Collector | Deployment, one desired replica | Kubernetes Events, cluster metrics, assigned singleton scrapes, OTLP application metrics, federation | Groundcover |
| Node Collector | StatefulSet, two fixed shards in the example | Divide node, kubelet, cAdvisor, and application scrape targets | Groundcover |
| Bundled Prometheus | Separate Prometheus server | Scrape inputs needed by local recording rules and expose selected results | Infra Collector through /federate |
| kube-state-metrics | Deployment in this setup | Expose Kubernetes object-state metrics | Assigned OTel and Prometheus scrapers |
| node-exporter | DaemonSet in this setup | Expose host metrics | Assigned OTel and Prometheus scrapers |
“Node Collector” does not mean one Collector Pod per Kubernetes node. A cluster might have 20 nodes and only two Node Collector Pods. Each shard scrapes a subset of the discovered targets.
The Infra Collector is the owner of the cluster-wide API watches. Kubernetes Events and the k8s_cluster receiver would otherwise be collected repeatedly by independent watchers. A FailedScheduling Event, for example, can concern a Pod that has not been assigned to any node.
KSM and API-server metrics are also scrape targets. Keeping those jobs on Infra is this chart’s ownership policy; scraping itself does not require a singleton. Similarly, receiving native OTLP metrics does not inherently require one replica. It shares the Infra role here.
The two Infra pipelines are therefore:
logs/events:
  k8s_events → Event-aware processing → batch → OTLP exporter

metrics:
  prometheus + k8s_cluster + otlp → metric processing → batch → OTLP exporter
The intended Node metrics pipeline keeps the Prometheus receiver and excludes k8s_events, k8s_cluster, and otlp. Those exclusions are custom chart behavior to check in the rendered configuration, not something OTel does because a Pod is called “Node Collector.”
One desired replica and one active owner
The historical Infra values specify replicaCount: 1 and disable autoscaling. That gives a steady-state singleton, but a rolling Deployment update can temporarily run an old and a new Pod together.
If overlapping collection is unacceptable, the deployment needs an explicit rollout or coordination strategy. A Recreate update can avoid the ordinary rolling-update overlap, with a collection gap while the replacement starts. Leader election is another design option only where the actual receiver/version supports it. The 0.110.0 Kubernetes Cluster Receiver recommends a single instance and does not document the leader-election setting found in newer versions.
Disabling HPA alone is not a lock. See Kubernetes rolling-update behavior.
Logs: from container output to OTel records
Let’s start with the flow of logs from a container.
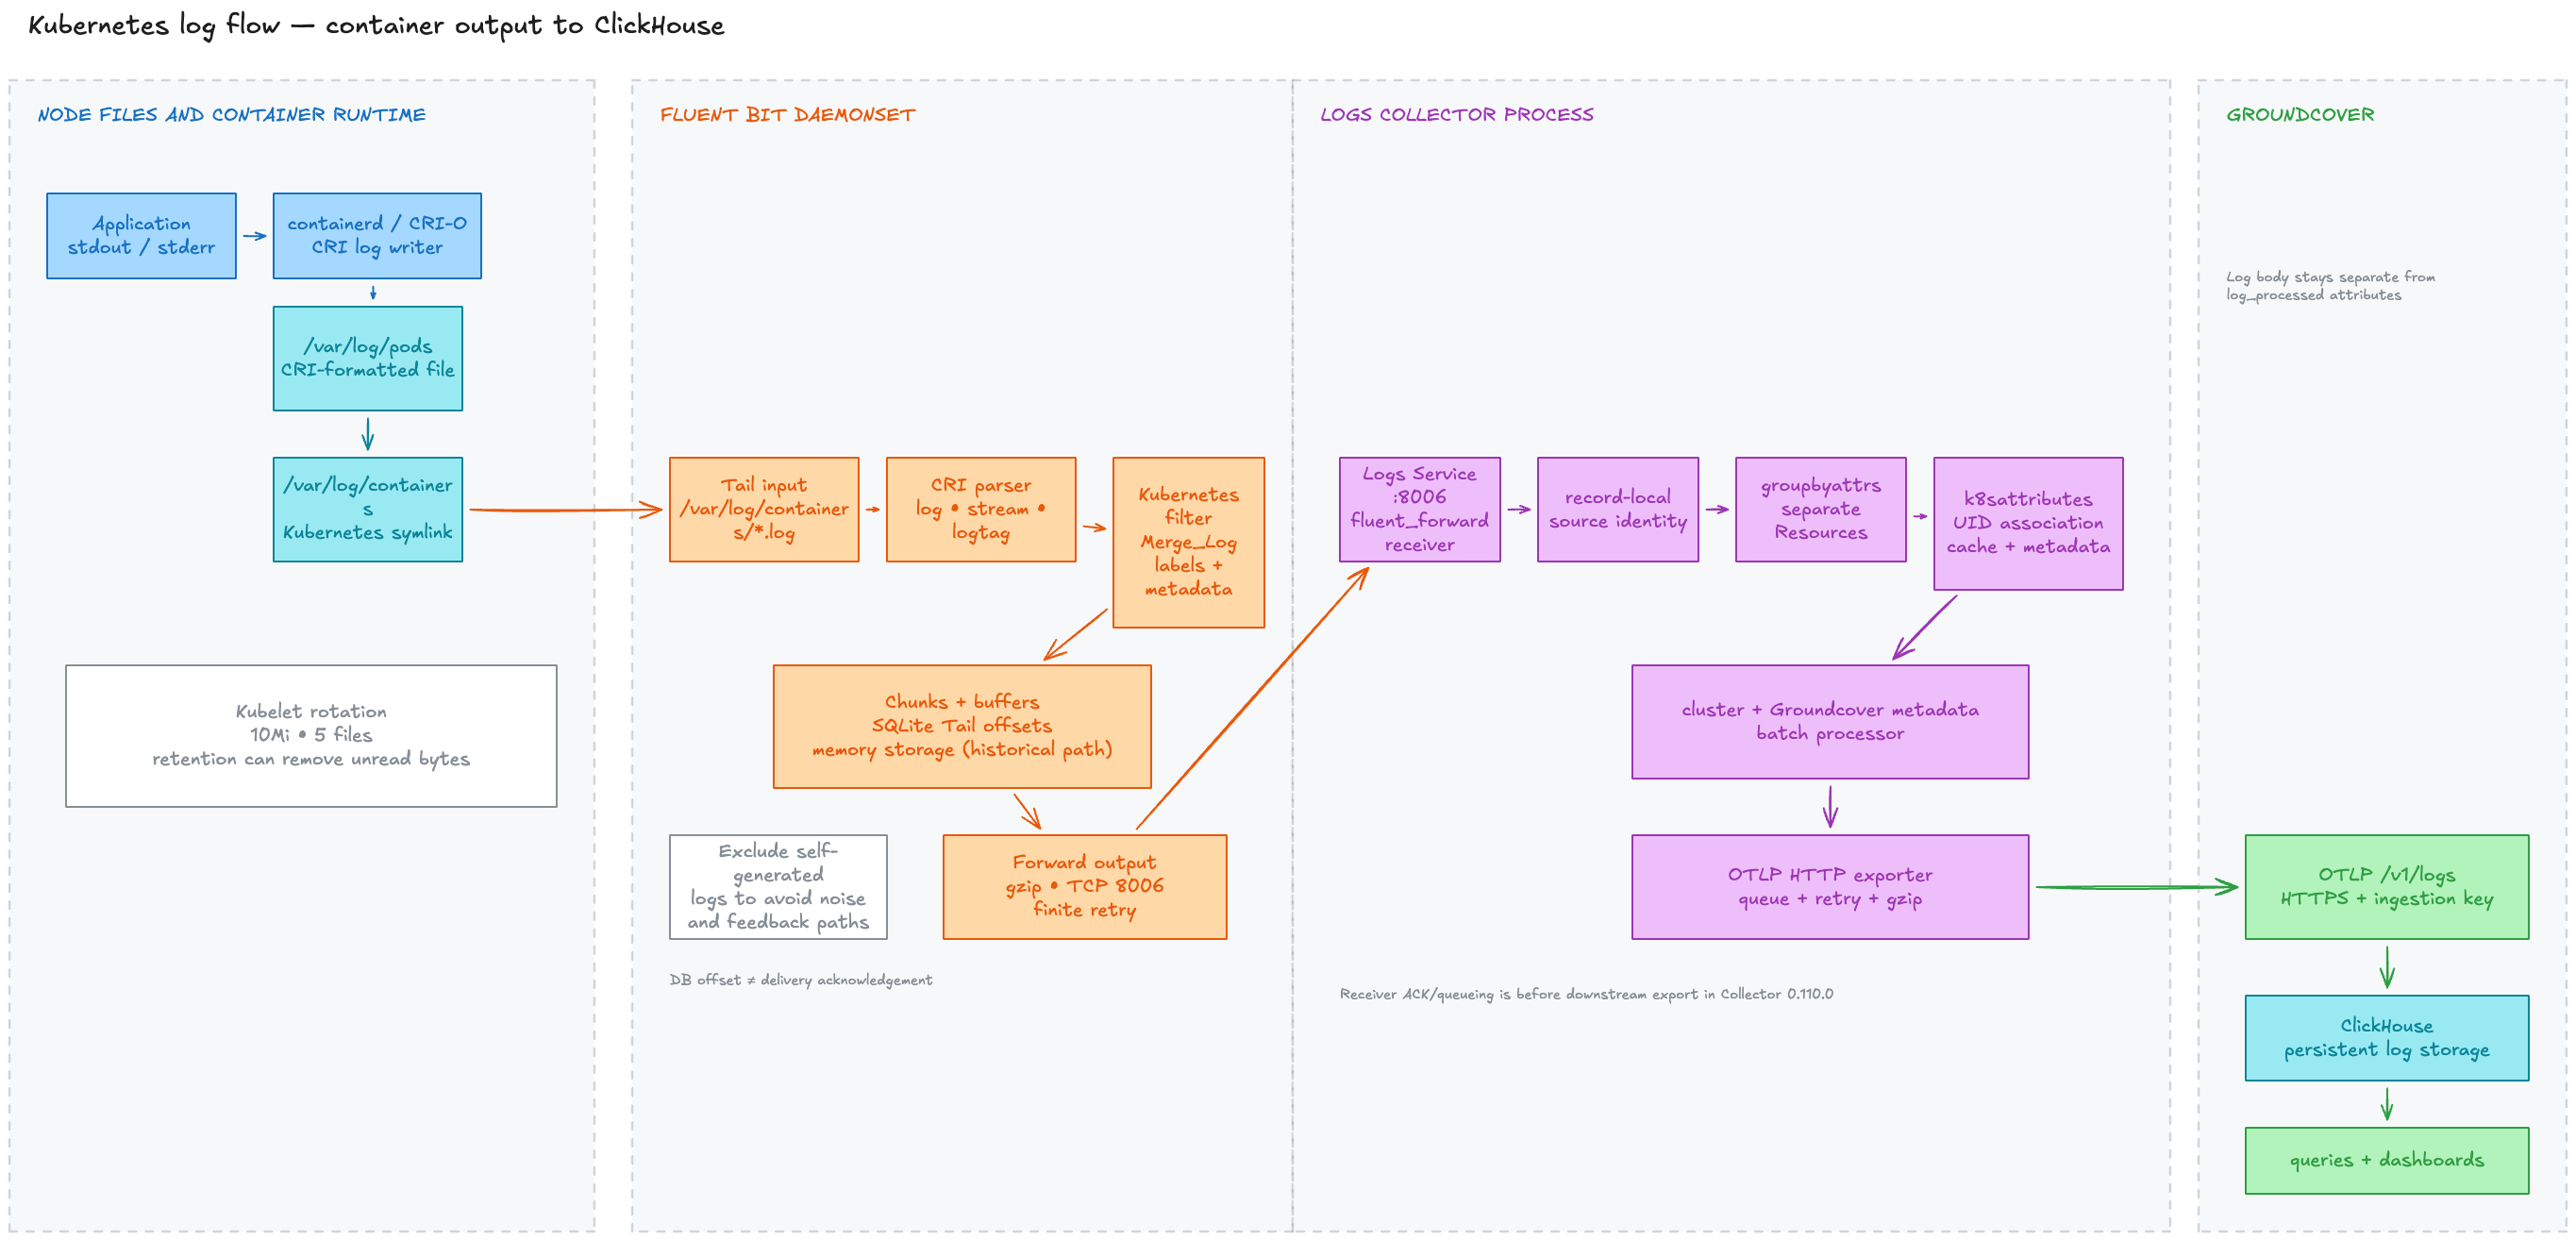
Figure: container output, node files, Fluent Bit, Forward transport, log identity reconstruction, and Groundcover log storage.
Step 1: The runtime writes the log file
In this path, the application writes to stdout and stderr. The container runtime, such as containerd or CRI-O, captures those streams. The kubelet and runtime coordinate log locations through the Container Runtime Interface (CRI).
An application can know its Kubernetes metadata through configuration or the Downward API, but this pipeline does not require it to attach that metadata itself.
On a typical Linux node, the kubelet directs the runtime to write below /var/log/pods. The conventional layout is:
/var/log/pods/
└── <namespace>_<pod-name>_<pod-uid>/
    └── <container-name>/
        └── <restart-count>.log
For the first container instance, the file is 0.log. A restarted instance can use 1.log. These numbers identify restart instances, not size-based rotation files, and the example does not mean every previous instance is retained indefinitely.
The kubelet also maintains discovery symlinks under /var/log/containers. Their filenames encode the Pod, namespace, container, and container ID:
/var/log/containers/<pod-name>_<namespace>_<container-name>-<container-id>.log
        ↓
/var/log/pods/<namespace>_<pod-name>_<pod-uid>/<container-name>/0.log
Container IDs in real discovery filenames are long identifiers. Any <container-id> used below is a placeholder, not a shortened ID to use when testing filename parsing.
Log rotation is controlled by the kubelet. Its defaults include:
containerLogMaxSize: 10Mi
containerLogMaxFiles: 5
These are rotation settings, not a promise that unread logs will remain available until a collector catches up. Paths can also be customized, and Windows nodes use different conventions. See Kubernetes logging and the kubelet’s path construction.
Step 2: Fluent Bit tails the files
Fluent Bit is a lightweight collector and forwarder. Here it runs as a node-local agent and reads /var/log/containers/*.log, following the symlinks to the actual files.
It behaves roughly like tail -f, with file discovery, parsing, offset tracking, buffering, and outputs added around it. It reads the node filesystem; it does not call kubectl logs for each record.
The main Tail settings are:
| Setting | What it does in this example |
|---|---|
Path /var/log/containers/*.log |
Selects container discovery files |
Tag kube.* |
Expands the source path into a routing tag |
Refresh_Interval 5 |
Scans for new matching files approximately every five seconds |
DB /var/log/flb_kube.db |
Stores reading positions in SQLite |
Read_from_Head Off |
Does not request replay from the beginning for startup files without a saved position |
Mem_Buf_Limit 50MB |
Limits memory-buffered chunks registered by this input |
Buffer_Max_Size 32k |
Makes the historical per-file buffer limit explicit |
Skip_Long_Lines On |
Skips oversized lines while continuing to monitor the file |
The per-file buffer and the chunk buffer are different limits. Neither is a limit on the Fluent Bit process’s total memory. There are also metadata caches, parser state, output workers, and other allocations.
Skipping a long line is intentional data loss. Keeping the historical 32k limit makes that behavior visible; choosing a larger value requires looking at actual log sizes and the number of files being tailed.
The original exclusions were:
Exclude_Path /var/log/containers/*fluent-bit*.log,/var/log/containers/*otel-collector-logs*.log
These reduce self-generated noise and protect against feedback paths, such as a debug exporter printing received records back into collected stdout. Collecting a Collector’s ordinary logs does not automatically create a loop.
The globs are broad: any matching filename is excluded. Use names specific to your deployment. Infra and Node Collector logs can remain available for remote diagnosis, but avoid exporting received telemetry to their collected stdout during normal operation.
Step 3: Parse the CRI envelope
A CRI line looks like this:
2026-08-29T10:15:20.123456789Z stdout F {"message":"request completed","status":200}
It contains a timestamp, stream, runtime tag, and application content. The corrected parser in the appendix captures that content under log, because the Kubernetes filter’s Merge_Log setting expects that field.
After successful parsing, the record is conceptually:
event timestamp: 2026-08-29T10:15:20.123456789Z
record:
  stream: stdout
  logtag: F
  log: '{"message":"request completed","status":200}'
Time_Key time uses the captured time as the event timestamp. Without Time_Keep On, the parsed time field is normally removed from the record map. Parsing a timestamp does not define how old files are replayed; that is part of Tail’s startup and database behavior.
There are two different multiline problems:
- The runtime can split one application write into CRI partial records, marked
P, followed by a final fragment markedF. - The application can write a message across several lines, such as a Java stack trace.
A regex parser only separates the envelope. It does not join either kind of message. Fluent Bit’s multiline.parser cri mode can reassemble runtime fragments, while application multiline handling needs an appropriate language or first-line parser. When using Tail’s multiline mode, replace the single-line parser setup according to that mode’s configuration; do not assume adding both switches combines their behavior.
The complete Fluent Bit example below is deliberately a single-line baseline. If partial records or stack traces occur in your workload, add and validate their reassembly before relying on one record per application message. See Tail 3.1 and parser configuration.
Step 4: Attach Kubernetes and cluster metadata
With Tag kube.*, a source path becomes a tag like:
kube.var.log.containers.api-123_default_api-<container-id>.log
The Kubernetes filter removes the configured Kube_Tag_Prefix, extracts identity from the remaining filename, and uses the Kubernetes API and its cache to enrich the record. The Pod UID comes from metadata lookup; the container ID in the filename is not the Pod UID.
Let’s go through the relevant filter settings:
| Setting | Meaning |
|---|---|
Match kube.* |
Process records with matching tags |
Kube_URL |
Kubernetes API address used for metadata lookup |
Kube_CA_File, Kube_Token_File |
Service-account credentials and CA used for the API connection |
Merge_Log On |
Attempt structured processing of the log content |
Merge_Log_Key log_processed |
Place successfully parsed application fields under log_processed |
Keep_Log On |
Keep the original log string after a successful merge |
Labels On |
Include Pod labels in the enriched metadata |
Annotations Off |
Do not include Pod annotations in the emitted metadata |
K8S-Logging.Parser On |
Allow annotations to select a registered application parser |
K8S-Logging.Exclude On |
Allow annotations to request log exclusion |
Buffer_Size 32k |
Limit the HTTP response buffer for metadata lookup |
Annotation-directed behavior and exporting annotations are separate settings. A Pod can request exclusion even when annotations are not copied into the outgoing record.
The metadata response buffer is also separate from Tail’s line buffer. If a Pod specification exceeds 32k, enrichment can fail. Size this for the objects in your cluster; using an unlimited buffer trades that failure mode for potentially higher memory use. See the Kubernetes filter documentation.
The modify filter then attaches the cluster and environment from deployment configuration. The corrected example uses Set, which overwrites an existing value. The historical Add rules only inserted values when those keys were absent. This matters if cluster identity is meant to be authoritative. See modify filter rules.
For our example, the enriched Fluent record looks like this. Unrelated metadata is omitted:
stream: stdout
logtag: F
log: '{"message":"request completed","status":200}'
log_processed:
  message: request completed
  status: 200
kubernetes:
  pod_name: api-123
  namespace_name: default
  pod_id: 11111111-2222-4333-8444-555555555555
  container_name: api
  host: worker-a
cluster_name: rnd-cluster
environment: development
Step 5: Buffer, route, and forward
Fluent Bit serializes records internally and groups them into chunks. Tags associate those chunks with routes. Both filters and the Forward output match kube.*; routing is part of Fluent Bit’s engine.
The historical configuration had a storage.path and a persistent Tail database, but no storage.type filesystem on the input. Its Tail chunks therefore used memory storage. A storage directory alone does not enable payload persistence.
The SQLite database answers “how far did Tail read?” It does not answer “how far did Groundcover successfully store?” Each node has its own database, even though the path is the same. It can survive a Fluent Bit Pod restart through the hostPath mount, but not loss of that node’s disk.
If reading pauses because of downstream pressure, unread bytes remain in the source files only until rotation or deletion removes them. If already-read records are buffered only in memory, a crash can lose them even though the database remembers a later offset. See Fluent Bit buffering.
The split logs path sends to otel-collector-logs.observability.svc.cluster.local on port 8006. This is an in-cluster Service name, not the shared Groundcover backend address.
The Forward output uses gzip and two flush workers. More workers can improve throughput when output concurrency is the bottleneck, but they also add concurrent work. Retry_Limit 5 is finite: a chunk can eventually be discarded after failed delivery attempts.
The Fluent Forward protocol boundary
Forward uses MessagePack. Its simple message mode is conceptually [tag, timestamp, record]; Forward and PackedForward modes carry multiple timestamped records under one tag. Packed payloads can be gzip-compressed. See the Forward protocol specification.
The OTel receiver accepts the connection, decodes the protocol, and creates OTel LogRecords. In Collector 0.110.0:
- The incoming tag is stored as
fluent.tagon each record. - The Fluent
logormessagefield becomes the OTel body. - Other fields, including nested Kubernetes metadata, become record attributes.
So our JSON string remains the body, and log_processed remains a separate attribute map. Creating log_processed does not automatically make it the OTel body. See the versioned conversion code.
The historical sender does not enable Require_ack_response. Successful TCP writing does not establish successful backend storage. Even with ACKs enabled, this receiver version acknowledges an event after placing it on an internal channel, before successful downstream export. We will come back to those delivery boundaries in the reliability section.
Log identity reconstruction
Now the Collector has log records. It still needs to associate them with the correct source.
An OTel LogRecord has a body, timestamp, severity, and record attributes. An OTel Resource describes the source and can be shared by multiple records. Pod identity belongs on the correct Resource when downstream processing expects resource-based association.
The 0.110.0 Forward receiver can collect several queued Forward events into one ResourceLogs group with an initially empty Resource. Those events may have different tags and come from different containers. This grouping happens inside the receiver, rather than because a single Forward message has multiple tags. See the receiver’s aggregation code.
Here is the problem we need to avoid:
one Resource group
  record A: Pod api-123
  record B: Pod payments-456

write A's Pod name into the shared Resource
write B's Pod name into the same Resource
  ↓
both records can now appear to belong to payments-456
The intended log pipeline is:
fluentforward receiver
  → memory_limiter
  → transform/fluent_source_identity
  → resource/clear_fluent_shared_identity, where needed
  → filter/drop_malformed_fluent_identity
  → groupbyattrs/fluent_identity
  → k8sattributes/fluent
  → cluster and Groundcover metadata
  → batch
  → otlphttp/groundcover
Copy identity into record attributes first
transform/fluent_source_identity is a custom transform instance. Its job is to map incoming Kubernetes fields into record-local identity:
| Incoming field | Record attribute before grouping |
|---|---|
fluent.tag |
source.fluent.tag |
kubernetes.pod_id |
k8s.pod.uid |
kubernetes.pod_name |
k8s.pod.name |
kubernetes.namespace_name |
k8s.namespace.name |
kubernetes.container_name |
k8s.container.name |
kubernetes.host |
k8s.node.name |
In OTel Transformation Language (OTTL), a statement in context: log can access both record and Resource attributes. The destination matters:
# Processor fragment: record-local assignment.
log_statements:
  - context: log
    statements:
      - set(attributes["k8s.pod.uid"], attributes["kubernetes"]["pod_id"]) where attributes["kubernetes"]["pod_id"] != nil
Writing to attributes[...] keeps this value on the record. Writing to resource.attributes[...] changes the shared Resource. The context alone does not protect it. See OTTL contexts in 0.110.0.
The historical notes also describe flat-field fallbacks and temporary fields such as source.k8s.service.name and metadata.identity.quality. Those need explicit statements and a defined input format. The complete log example in the appendix supports the nested Fluent Bit format shown here; it does not claim to reconstruct missing metadata from arbitrary tags.
Clear old shared identity only where it exists
The stock receiver starts with an empty Resource. It does not supply an already populated “Forward Resource.”
If an earlier custom stage attached unsafe source identity, clear it before grouping. The historical cleanup list includes Pod, namespace, container, node, workload-controller names, service.name, and workload. Define exactly which keys can be stale; avoid deleting valid source identity indiscriminately.
For the direct receiver-to-transform example below, there is no earlier Resource enrichment to clear. That is why its complete configuration does not include a redundant clearing processor.
Decide what happens to malformed identity
The historical design drops records whose source identity cannot be trusted. That is a data-loss policy, so its conditions should be visible.
The example below rejects a missing or invalid discovery tag, missing Pod UID, or missing Pod, namespace, or container name. It expects the normal 64-character container ID in the tag. The transform should also check for conflicts between tag-derived names and metadata if both are used as authoritative inputs; a shape check alone does not establish that the fields agree.
Metadata lookup failure is not proof that the application log itself is bad. Another policy is to route incomplete records to a separate diagnostic destination and retain the raw tag. Whichever policy you choose, count rejected records and investigate a rise in failures. Avoid dumping rejected records into the same collected stdout path.
Group records and promote identity
groupbyattrs/fluent_identity groups records by selected attributes and promotes those keys to Resource attributes. Promoted keys are removed from the record attributes. This is what makes Pod UID association available to the next processor.
Our example becomes:
Resource:
  k8s.pod.uid: 11111111-2222-4333-8444-555555555555
  k8s.pod.name: api-123
  k8s.namespace.name: default
  k8s.container.name: api
  k8s.node.name: worker-a
  source.fluent.tag: kube.var.log.containers.api-123_default_api-<container-id>.log

LogRecord:
  body: '{"message":"request completed","status":200}'
  timestamp: 2026-08-29T10:15:20.123456789Z
  attributes:
    stream: stdout
    logtag: F
    log_processed: {message: request completed, status: 200}
    kubernetes: ...
Records from payments-456 receive a different Resource group. The processor is not an identity validator: partial keys can still produce groups, and records with none of the grouping keys can remain under their original Resource. That is why validation comes first. See groupbyattrs 0.110.0.
Enrich using the source Pod UID
The Fluent-specific Kubernetes Attributes Processor uses:
pod_association:
  - sources:
      - from: resource_attribute
        name: k8s.pod.uid
The connection reaching the gateway belongs to Fluent Bit, not necessarily to the original application. Using that connection’s IP to identify the application can attach the wrong Pod.
The processor maintains a Kubernetes metadata cache. With the right extract.metadata, label extraction, and RBAC settings, it can add controller names such as Deployment, ReplicaSet, StatefulSet, DaemonSet, Job, and CronJob where they exist. Container metadata needs enough container identity as well. It does not automatically populate every possible field for every record.
After enrichment, the pipeline can derive a logical service.name from a declared fallback order: an application label, then an available workload-controller name, for example. A label called app is a convention, not proof of a Kubernetes Service relationship. The original helper’s exact fallback order needs its source code; the appendix uses a smaller, explicit rule.
Similarly, setting host.name from k8s.node.name is a chosen naming convention, not a separate host discovery operation. See the Kubernetes Attributes Processor.
How the log leaves the Collector
At this point, the LogRecord has been associated with its source Pod and enriched with Kubernetes metadata. The remaining log pipeline is:
k8sattributes/fluent
  → resource/cluster
  → transform/workload_metadata
  → resource/groundcover
  → batch
  → otlphttp/groundcover
transform/workload_metadata derives fields such as service.name and host.name where the available metadata supports them. The batch processor groups LogRecords, and the configured OTLP/HTTP exporter serializes the batch, applies compression and authentication, and sends it to the backend’s logs endpoint.
A successful HTTP response means the ingestion endpoint accepted the request. It does not by itself prove that the log has already been indexed or is queryable. The shared export section covers those queues, retries, and delivery boundaries.
Kubernetes Events: API objects to log records
Now we move on to Kubernetes Events. Their collection path is separate from container stdout and stderr.
The kubelet, scheduler, built-in controllers, operators, and custom controllers can submit Event objects to the Kubernetes API. Image-pull failures and runtime operations can cause Events, but the runtime operation itself is not another Event-watching collector.
The k8s_events receiver watches new and updated Event objects. With the default namespace scope and suitable service-account permissions, it watches across namespaces. It converts those objects into OTel log records, which is why Events enter a logs/events pipeline.
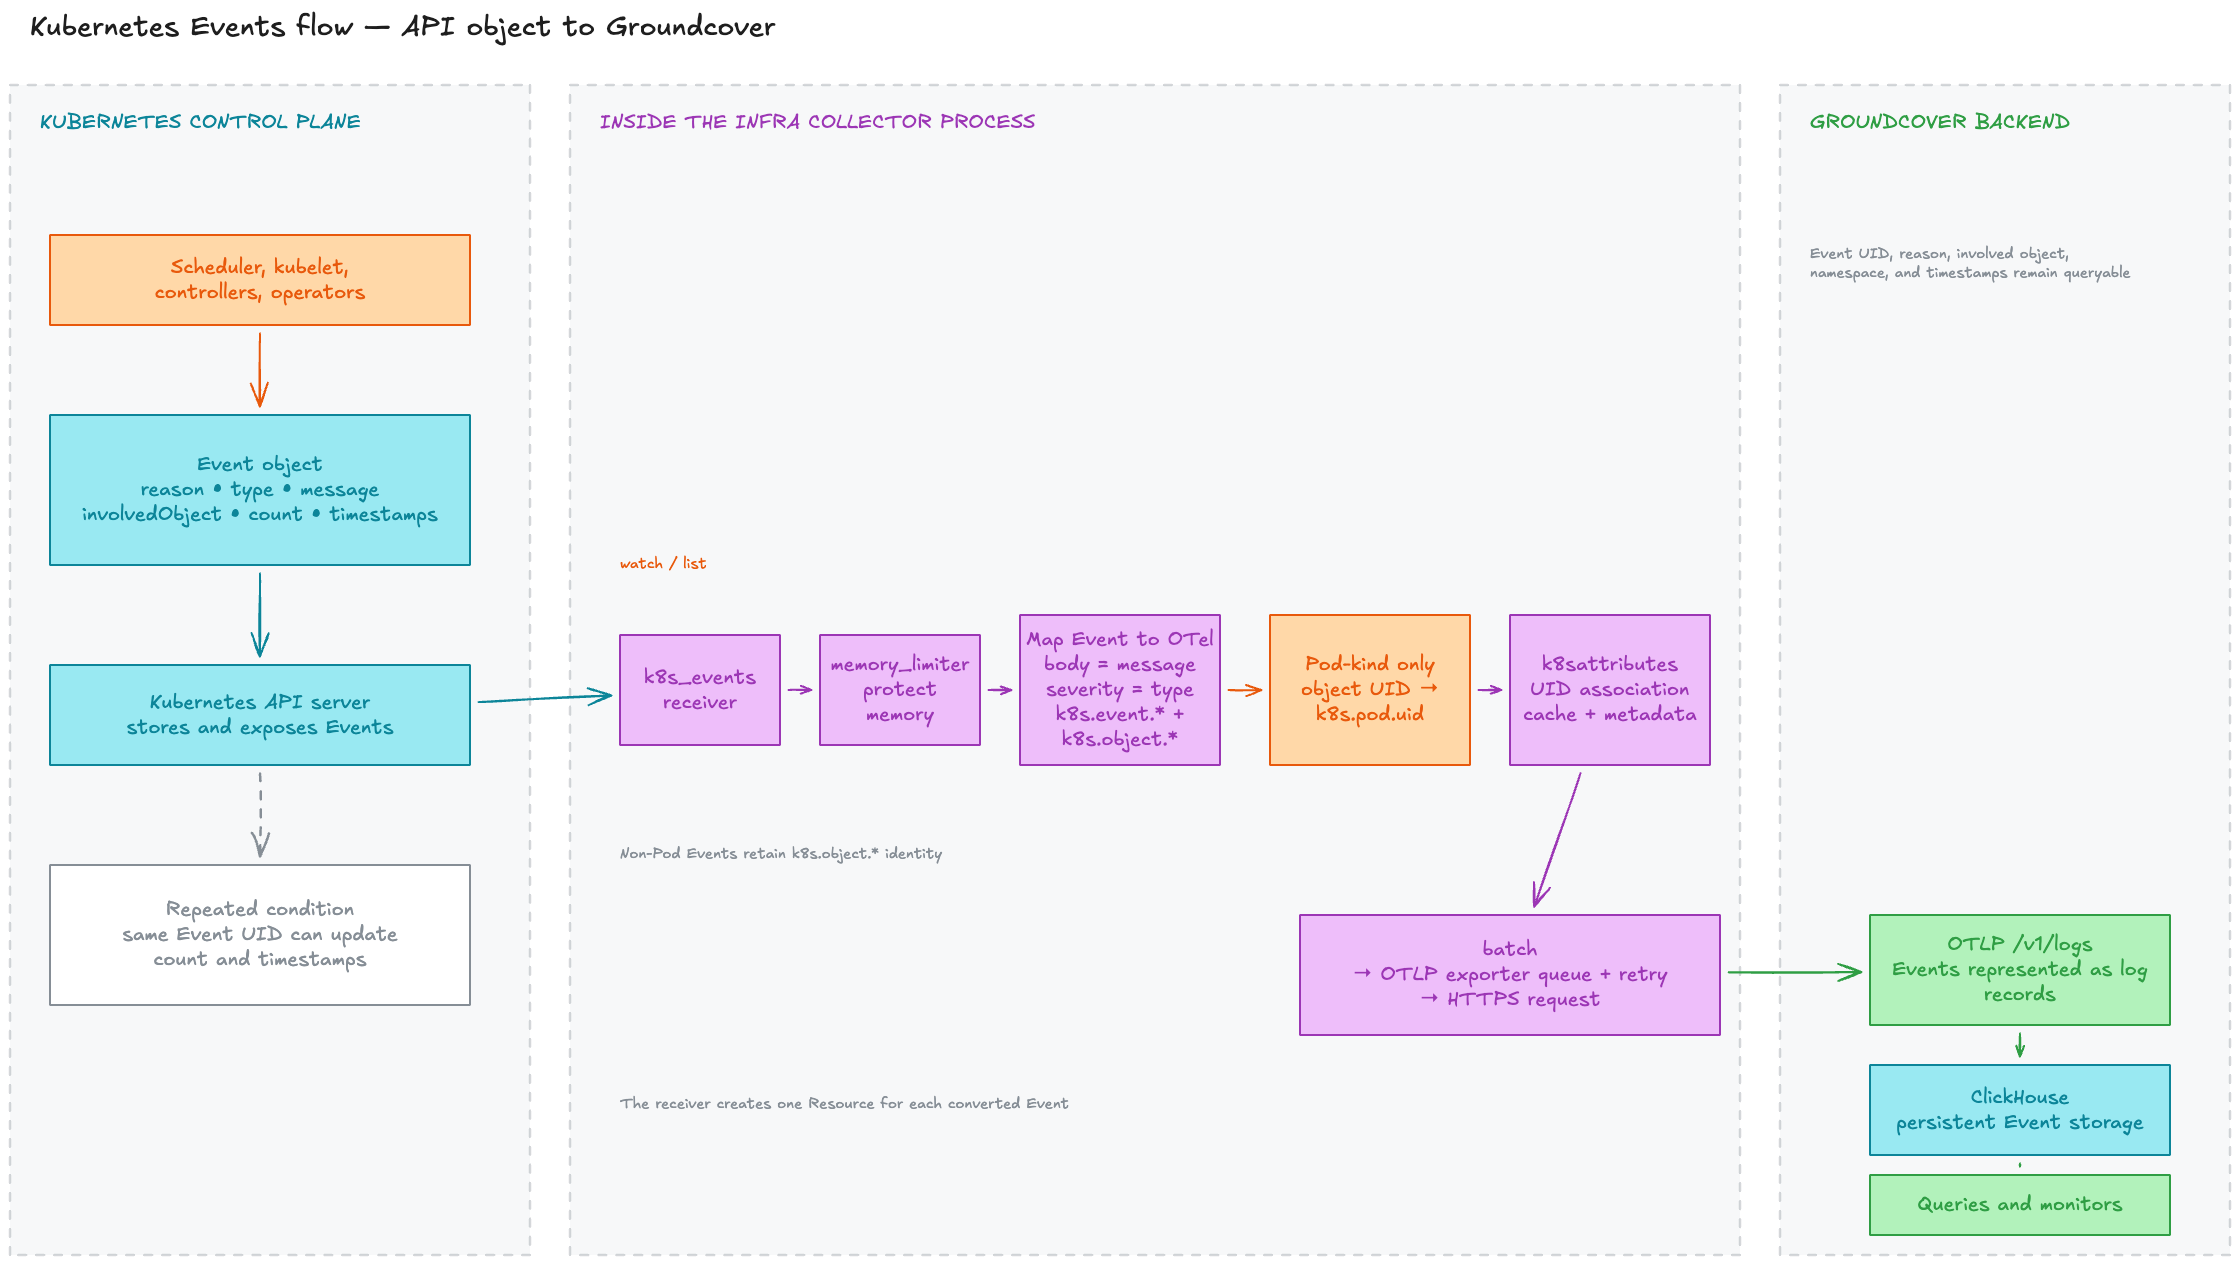
Figure: Event creation, API watching, OTel mapping, Pod-only UID association, export, and ClickHouse storage.
For Collector 0.110.0, a representative conversion is:
# Abbreviated data example, not Collector configuration.
resource:
  k8s.object.kind: Pod
  k8s.object.name: api-123
  k8s.object.uid: 11111111-2222-4333-8444-555555555555
  k8s.object.api_version: v1
  k8s.node.name: worker-a
log_record:
  body: Back-off restarting failed container
  severity_text: Warning
  severity_number: 13
  attributes:
    k8s.event.reason: BackOff
    k8s.event.name: api-123.example-event
    k8s.event.uid: aaaaaaaa-bbbb-4ccc-8ddd-eeeeeeeeeeee
    k8s.event.count: 3
    k8s.namespace.name: default
The message becomes the body. The Event type supplies severity. The involved object’s identity is separate from the Event object’s own identity. k8s.node.name comes from the Event source host and may be empty. See the 0.110.0 Event conversion.
Associate the involved object carefully
For an Event involving a Pod, an explicit transform can copy k8s.object.uid to Resource k8s.pod.uid before UID-based enrichment. Only do this when k8s.object.kind is Pod. A Node, PVC, or Deployment UID is not a Pod UID.
Keep k8s.object.* even when Pod enrichment succeeds. If the Pod has already disappeared from the metadata cache, the Event still has useful involved-object information. Do not run Events through the container-log filter that requires a Fluent tag.
The corrected processing order is sequential. The Events diagram above shows the receiver, identity mapping, enrichment, batching, and export stages together.
A generic k8sattributes processor does not automatically turn k8s.object.uid into a Pod association. The appendix includes the mapping fragment. Resource detection, if used here, should attach only context that is valid for the Event source; the Infra Collector’s host is not necessarily the involved object’s host.
Repeated Events are not separate incidents
Kubernetes can update an existing Event’s count and timestamps as a condition repeats. Seeing k8s.event.count: 3 and later 5 does not mean eight occurrences. It can be the same Event updated from three to five occurrences.
Use Event UID, reason, involved object, and time when interpreting updates. Account for counter resets and missing updates rather than summing every observed count. Events are best-effort operational observations with limited API retention, not a durable audit trail or a guarantee that every state transition will be recorded. Exporting an observed Event preserves that observation; it cannot recover one that was never emitted or was missed before expiration. See the Kubernetes Event API and Events receiver.
How a Kubernetes Event leaves the Collector
The Event now exists as an OTel LogRecord. The transform/event_pod_identity processor maps the involved object’s UID to k8s.pod.uid only when the involved object is a Pod. The Kubernetes Attributes Processor can then enrich that Event from the Pod metadata cache.
k8sattributes/events
  → resource/cluster
  → resource/groundcover
  → batch
  → otlphttp/groundcover
Events use the logs/events pipeline because the receiver represents Kubernetes Event objects as OTel log records. The original k8s.object.* fields remain important even when Pod enrichment succeeds, especially when the involved Pod has already disappeared.
From this point onward, Events use the same batching, queueing, retry, and backend ingestion boundary as container logs.
Metrics: sources and collection paths
The metrics pipeline uses the same receiver → processor → exporter model, but its inputs come from three mechanisms:
- The Prometheus receiver scrapes HTTP endpoints exposing metrics.
- The
k8s_clusterreceiver observes Kubernetes API state and generates cluster metrics. - The OTLP receiver accepts metrics pushed by instrumented applications.
The Prometheus receiver does not receive application OTLP requests. Those go to the OTLP receiver, even when both receivers run in the same Collector process.
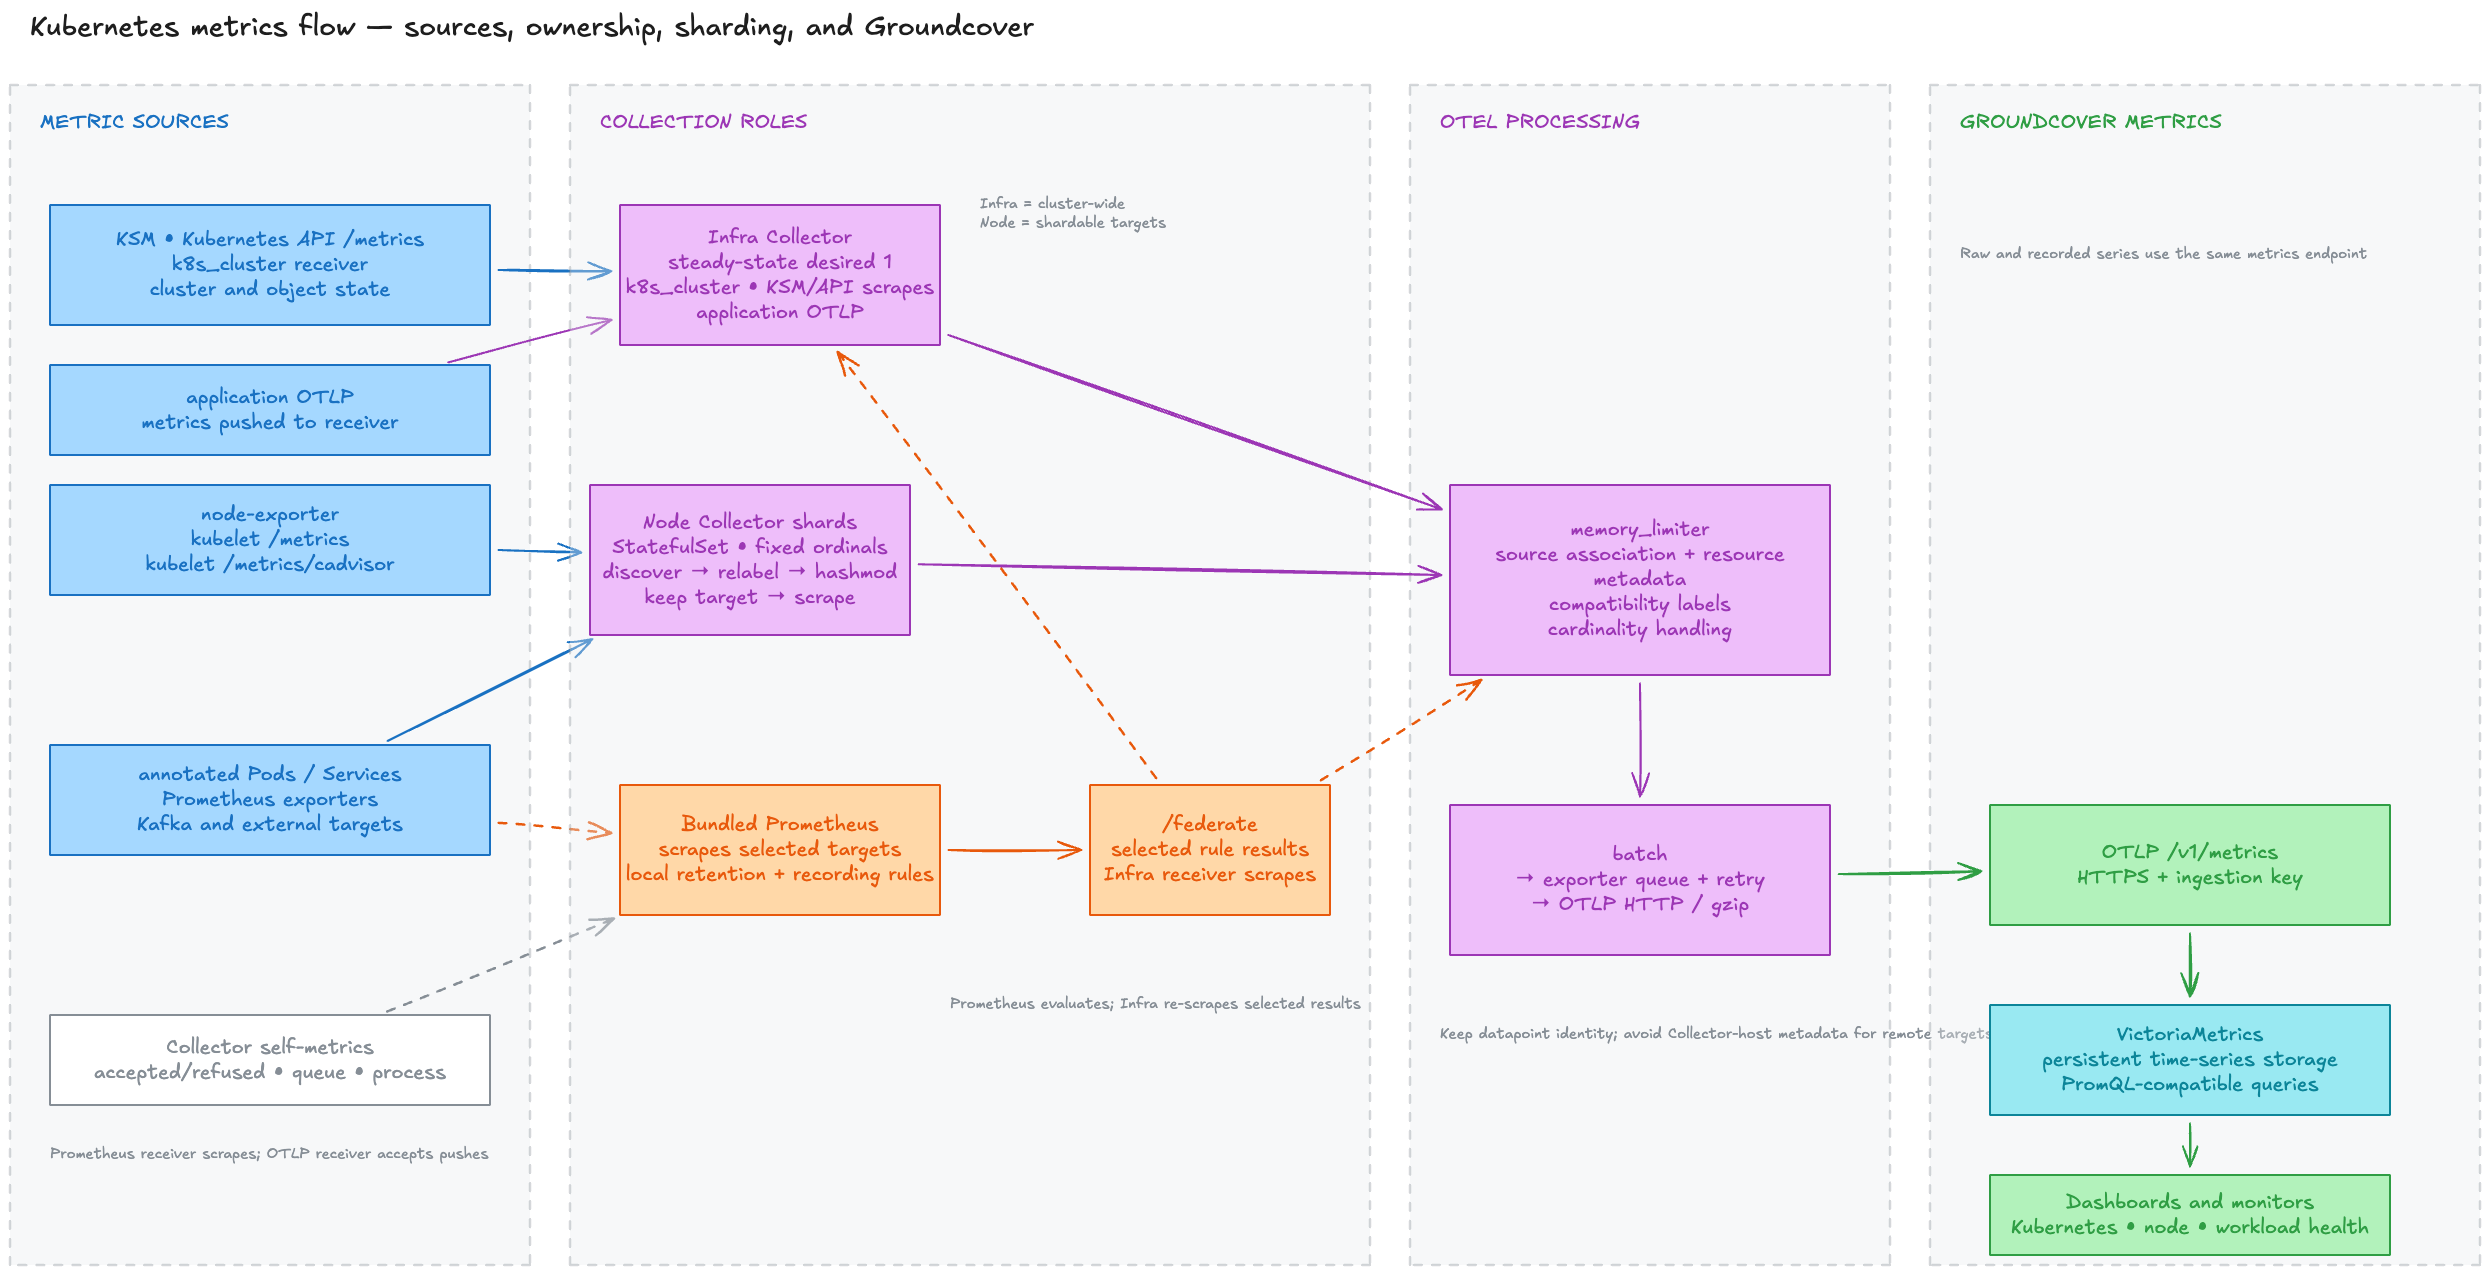
Figure: metric sources, Infra and Node ownership, Prometheus federation, shared OTel processing, and VictoriaMetrics storage.
Where the metrics come from
| Source | What it describes | Examples | Intended OTel owner |
|---|---|---|---|
| Application Prometheus endpoint | Application behavior | Request counters, latency histograms, queue depth | Node shard |
| Application OTLP export | Instrumented application metrics | Counters, gauges, histograms from an OTel SDK | Infra in this setup |
| kube-state-metrics (KSM) | Kubernetes object state | kube_pod_status_phase, kube_pod_owner, kube_deployment_status_replicas_available |
Infra |
k8s_cluster |
Cluster-level state through the API | Node conditions, workload and container state metrics supported by the receiver | Infra |
| node-exporter | Host resource usage and operating-system state | node_cpu_seconds_total, node_memory_MemAvailable_bytes, node_filesystem_avail_bytes |
Node shard |
API server /metrics |
API-server behavior | apiserver_request_total, apiserver_request_duration_seconds, apiserver_request_terminations_total |
Infra-assigned job |
kubelet /metrics |
Kubelet operations | Pod lifecycle, runtime operations, volume operations | Node shard |
kubelet /metrics/cadvisor |
Container resource usage | container_cpu_usage_seconds_total, container_memory_working_set_bytes |
Node shard |
| Kafka and other exporters | Broker, database, or external-service metrics | Exporter-specific metric families | Explicit job assignment |
| Collector self-metrics | Collection and export health | Accepted/refused records, export failures, queue size, process memory | Per-instance self-scrape or dedicated discovery |
KSM watches the API and exposes object-state metrics. It can tell you available Deployment replicas or Pod phase, but it does not provide all the CPU, application, and component-health metrics needed for Kubernetes dashboards. See kube-state-metrics.
node-exporter runs as a DaemonSet here, but it can also run on an ordinary VM. Host filesystem, network, and other metrics depend on its enabled collectors and access to the host.
For cAdvisor, this setup scrapes the endpoint exposed by the kubelet. It does not require us to deploy a separate cAdvisor daemon. Available metrics vary by Kubernetes version, runtime, operating system, and configuration. Examples also include container_network_receive_bytes_total, container_network_transmit_bytes_total, and container_fs_usage_bytes; do not assume every runtime provides every series. See Kubernetes component metrics.
The API-server histogram name above is a family name. In a classic Prometheus exposition, its samples include suffixes such as _bucket, _sum, and _count.
Application discovery requires scrape configuration
A Pod can declare:
metadata:
  annotations:
    prometheus.io/scrape: "true"
    prometheus.io/port: "8080"
    prometheus.io/path: "/metrics"
Those annotations are conventions. The receiver needs Kubernetes service discovery and relabeling rules that actually interpret them. The appendix includes an illustrative Pod job with an explicit port-selection contract.
For Services, distinguish a Service address from its individual backing endpoints. Scraping a load-balanced Service address can alternate between replicas. If the intention is to collect each replica, discover the endpoints and retain their identities. If both a Pod job and a Service-endpoint job select the same endpoint, hashmod inside each job does not prevent the two jobs from scraping it twice.
Dedicated exporters such as KSM should be excluded from generic discovery when another job already owns them. External VMs and brokers may use static targets or provider-specific discovery instead of Pod annotations. See the Prometheus receiver configuration.
Kubelet and cAdvisor through the API proxy
The historical design reaches node endpoints through the Kubernetes API server:
Node Collector sends an HTTPS scrape request
        ↓
Kubernetes API server authenticates and authorizes it
        ↓
/api/v1/nodes/<node>/proxy/metrics
or /api/v1/nodes/<node>/proxy/metrics/cadvisor
        ↓
selected kubelet returns metrics
        ↓
Node Collector parses the response
The request needs the Kubernetes CA, service-account credentials, and authorization for the node proxy. The API-server /metrics scrape has a separate authorization requirement for that non-resource URL.
This path adds API-server traffic for every node scrape. Direct kubelet scraping is another topology, with its own network, certificate, and authorization requirements. The API proxy should be a deliberate choice, especially as node count grows.
Similarly, one Infra Collector scraping API-server metrics does not mean there is only one API-server process. For per-instance counters, target selection must cover the intended control-plane instances without mixing their identities. Managed clusters may restrict what can be reached.
How a metric moves through OTel
Suppose KSM exposes:
kube_deployment_status_replicas_available{namespace="backend",deployment="api"} 3
The Infra Collector’s Prometheus receiver scrapes KSM and converts this into an OTel metric datapoint. The namespace and deployment labels describe the Deployment represented by the sample. They are not automatically Resource attributes describing the KSM Pod.
The intended processing is:
Prometheus receiver
  → memory_limiter
  → appropriate source association
  → cluster metadata
  → dashboard compatibility transforms, if configured
  → cardinality handling that preserves series identity
  → Groundcover metadata
  → batch
  → OTLP exporter
The historical processor names for the compatibility stages are transform/prometheus_compat_dashboards and transform/drop_high_cardinality. Their names do not tell us which statements they execute. Any claimed label changes need the actual rules.
Now consider a cAdvisor sample:
container_memory_working_set_bytes{namespace="backend",pod="api-123",container="api"} 104857600
A Node shard collects it from one kubelet, but that kubelet returns metrics for many containers. The number is 100 MiB in bytes. The datapoint labels identify the measured container. Attaching the Collector Pod’s metadata to the whole scrape would describe the collector rather than the measured workload.
If downstream processing needs per-workload Resource identity, deliberately map and group the relevant datapoint attributes before resource-based enrichment. If the backend uses the Prometheus labels directly, retain those labels. Do not assume k8sattributes can infer every represented workload from the scraped endpoint.
Metric target sharding and ownership
The Node Collector divides scrape targets across fixed shards. Each replica performs discovery, then target relabeling retains only its assigned targets before scraping.
discover candidate targets
        ↓
apply annotation, endpoint, and exclusion rules
        ↓
hashmod assignment
        ↓
keep targets assigned to this shard
        ↓
scrape → OTel datapoints → processing → export
Why a StatefulSet is used
The two Pods have stable ordinals:
otel-collector-node-0 → relay-0
otel-collector-node-1 → relay-1
The historical notes describe an init container that takes the ordinal from the Pod name and copies the corresponding configuration to /conf/relay.yaml. That is a custom chart mechanism. A StatefulSet supplies stable ordinals; the chart must supply the files, mounts, selection logic, and restart behavior.
If an init container copies a ConfigMap file into another volume, later ConfigMap updates do not automatically recopy that file. Updating the source configuration needs a deliberate Pod restart or another explicit reload mechanism.
How hashmod works
For two shards, Prometheus relabeling hashes the selected source labels and reduces the result modulo two. The result is 0 or 1.
This fragment belongs at the end of a node-discovery job’s target relabeling rules for shard 0:
relabel_configs:
  - source_labels: [__meta_kubernetes_node_name]
    modulus: 2
    target_label: __tmp_shard
    action: hashmod
  - source_labels: [__tmp_shard]
    regex: "0"
    action: keep
Shard 1 uses the same discovery rules and modulus, with regex: "1". The source label must exist for that job’s discovery role. If it is empty on every target, hashing it does not distribute the targets meaningfully.
The selected labels also define the grouping granularity:
| Target | Possible hash input | Consequence |
|---|---|---|
| Pod endpoints | __meta_kubernetes_pod_uid |
All endpoints from that Pod go together; a recreated Pod has a new UID |
| Service endpoints | Namespace plus Service name | One Service’s endpoints go together; including namespace avoids treating same-named Services as one group |
| Node targets | __meta_kubernetes_node_name |
Jobs using the same node identity can assign that node consistently |
| External target | __address__ |
Assignment follows the configured host and port |
Hashing only a Service name does not itself create duplicate scraping, but it can place unrelated same-named Services on the same shard. Hashing an endpoint identity instead allows finer distribution when one Service has many endpoints.
Each shard must use the same target definitions, hash inputs, and modulus, with a unique keep value. See Prometheus relabeling.
Scaling and failure behavior
Changing from two to three shards changes hash(identity) % 2 into hash(identity) % 3. Many targets move. If some Pods still use the old configuration, there can be gaps and overlaps.
This is why the historical Node role disables HPA. Changing only the StatefulSet replica count does not update all shard configurations. Scale by regenerating every shard config and coordinating the rollout; a dynamically assigned target system would be a different design.
A failed shard also does not cause the surviving shard to take its targets automatically. Its targets go unscraped until the shard recovers or assignment changes. Fixed sharding distributes work; it does not provide automatic scrape failover. The Prometheus receiver documentation calls out its stateful nature and the need for different scrape configurations across replicas.
Bundled Prometheus and recording-rule federation
Bundled Prometheus is another collection path, used here for local rule evaluation. The historical diagram specifies two days of local retention; that is a deployment setting to confirm in the Prometheus arguments, not a default implied by this architecture.
Its role is:
scrape raw targets → store local samples → evaluate recording rules → expose selected results
The OTel Collectors deliver raw metrics and selected derived metrics to Groundcover through separate paths:
Raw metric endpoint
   ├── OTel Prometheus receiver → OTel processing → Groundcover
   └── Bundled Prometheus → recording rules → /federate
                                              ↓
                                      Infra Prometheus receiver
                                              ↓
                                        OTel processing
                                              ↓
                                          Groundcover
Two scrapers intentionally contact some of the same raw targets. This costs target CPU, network traffic, and local Prometheus storage. It avoids exporting raw metrics twice only if the federation job selects the derived results and there is no additional overlapping export path.
Recording rules
A recording rule evaluates a PromQL expression and stores the result as a named time series. Rules can cover namespace CPU usage, workload ownership, Kubernetes API behavior, or node utilization, saturation, and errors (USE).
For example, this illustrative rule calculates CPU usage in cores by namespace:
groups:
  - name: byoc-example
    interval: 30s
    rules:
      - record: namespace:container_cpu_usage_seconds_total:sum_rate5m
        expr: sum by (namespace) (rate(container_cpu_usage_seconds_total{container!="",container!="POD",namespace!=""}[5m]))
This assumes one scrape per input container series and a single monitored cluster in this Prometheus instance. The five-minute range uses historical local samples; the rule result is not simply the latest raw counter value.
This is an example rule, not a reconstruction of the custom chart’s dashboard rules. Their names, expressions, and label expectations need to be checked together with the dashboards.
Federation
/federate can return selected raw or recorded series. The match[] selectors decide what is returned; the endpoint is not limited to recording rules by itself.
An illustrative Infra scrape job for the example above is:
- job_name: prometheus-federate-dashboard-rules
  scrape_interval: 30s
  metrics_path: /federate
  honor_labels: true
  params:
    'match[]':
      - '{__name__="namespace:container_cpu_usage_seconds_total:sum_rate5m"}'
  static_configs:
    - targets: [prometheus.observability.svc.cluster.local:9090]
Replace the target with the actual Prometheus Service. honor_labels preserves conflicting labels supplied by the source, including job and instance when present. Review external cluster labels too, especially when combining several Prometheus instances. See Prometheus federation.
Federation fetches current selected samples. It is not a historical backfill mechanism: after a prolonged outage, scraping /federate does not replay every missed rule evaluation.
How metrics leave the Collector
Once a metric has been scraped, generated from Kubernetes API state, or received through OTLP, it becomes an OTel metric datapoint. The exact processors differ between the Infra and Node roles, but the final path follows the same pattern:
metric receiver
  → memory_limiter
  → source and cluster metadata
  → compatibility and cardinality processing
  → resource/cluster
  → resource/groundcover
  → batch
  → otlphttp/groundcover
For metrics collected by the Node role or bundled Prometheus, sharding and federation happen before the datapoints reach this shared export boundary. The OTLP/HTTP exporter sends metrics to the backend’s metrics endpoint.
The datapoint labels describe the measured workload or target. The Collector’s own identity should not replace that source identity. An accepted export request still needs to be verified through backend queries, including the expected cluster, namespace, workload, job, and instance labels.
Shared processing, batching, and export
We have now seen what differs between the signals: where they come from, how ownership is assigned, and how source identity is established. The remaining stages share the same purposes, although each role needs settings appropriate to its volume and signal.
Memory limiting
The historical example uses:
memory_limiter:
  check_interval: 2s
  limit_percentage: 80
  spike_limit_percentage: 25
The hard limit is calculated from 80% of the memory basis the processor sees. The soft limit is hard minus spike, giving 55% with these values. Refusals begin above the soft limit; the hard limit also triggers forced garbage collection. Confirm the available-memory basis against the container’s actual memory limit.
This is a periodically checked mitigation, not a hard allocation cap. Fast growth between checks and other allocations can still result in an out-of-memory failure.
The limiter returns errors to the preceding component. Recovery depends on that component’s retry behavior. Collector 0.110.0’s Forward loop records a downstream error but does not requeue the affected records, so refusal can lose logs. Do not describe this path as reliable end-to-end backpressure. See the memory limiter and Forward loop.
Resource detection and cluster identity
resourcedetection can discover cloud or host information from the environment where the Collector runs. For a gateway processing remote targets, that environment may belong to the Collector’s node, not the source node.
Only enable detectors whose output is valid for the data passing through them. override: false protects existing values, but can still add a misleading local value when the source has no value. For example, filling a missing host.id from the gateway does not identify a remote cAdvisor target. See resource detection.
Static cluster context is easier to reason about when one Collector role serves one monitored cluster:
k8s.cluster.name: rnd-cluster
deployment.environment.name: development
cloud.provider: aws
cloud.region: ap-south-1
Only set cloud.region globally if it describes all represented sources. External targets in another region need their own metadata. If a gateway receives multiple clusters, derive identity from a trusted per-source boundary rather than overwriting all data with one cluster name.
deployment.environment is deprecated in favor of deployment.environment.name. Keep the older key only when an existing dashboard or backend mapping requires it, and use the same normalized value for both. See deployment conventions.
Dashboard labels and cardinality
The compatibility transforms in the historical design deal with labels such as job, instance, namespace, and metrics_path. These labels influence grouping and dashboards. Set them from the scrape target or represented object, rather than guessing them from the Collector Pod.
The transform/drop_high_cardinality name is not enough to establish that removing a field is safe. Suppose two series differ only in a request_id. Deleting that attribute gives both series the same identity; it does not automatically sum, average, or otherwise aggregate their values correctly.
Keep dimensions that distinguish sources unless there is an explicit aggregation appropriate to the metric type. Prefer avoiding unnecessary dimensions at instrumentation time. No historical drop list is available here, so the examples do not invent one. See the OTel metrics data model for identity and reaggregation semantics.
Groundcover metadata
The historical mapping adds env_name, clusterId, and gc_source_type, alongside OTel resource conventions. Treat these as a backend/deployment mapping to verify, not universal OTel fields required by every exporter.
For the sample cluster, those values are development, rnd-cluster, and k8s. The logical service.name comes from the workload mapping. Temporary fields such as source.k8s.service.name or gc_env_type can be removed after their final values have been derived. The Fluent source tag can be retained for diagnosis or removed by an explicit policy after grouping.
Mapping into Groundcover’s query fields must be checked at ingestion. Setting an arbitrary attribute does not by itself guarantee a particular indexed column or dashboard label. Groundcover documents OTel resource and header-based enrichment in its Collector integration.
Batch processing
The logs example uses a 512-record send trigger, a 1,024-record maximum, and a five-second timeout. These are counts of log records, not bytes. For metrics, the analogous counts are datapoints.
send_batch_size is a trigger, not an exact request size or hard maximum. send_batch_max_size is the count cap. A smaller batch can be sent when the timeout expires.
Batching reduces request overhead, but adds waiting and memory use. A thousand large log records can be much larger than a thousand small ones, so count limits must be considered alongside backend request limits. See the 0.110.0 batch processor.
OTLP HTTP export
The exporter is inside each Collector process. With queueing enabled, the flow is:
processor output
    ↓
batch processor
    ↓
exporter sending queue
    ↓
queue consumer
    ↓
OTLP serialization + gzip + authentication
    ↓
HTTPS request
    ↓
response handling and retry when applicable
The example uses four queue consumers, a queue size of 10,000, a 30-second timeout per export attempt, and retry intervals starting at five seconds with a 30-second maximum interval. Retry timing includes backoff behavior; it is not an exact fixed schedule. max_elapsed_time: 300s limits the retry window for a sending operation, not every record’s total residence time in the pipeline.
In Collector 0.110.0, queue size counts batches/requests, not individual records or bytes. With no storage extension, this is an in-memory queue. Queued data can be lost on restart, queue exhaustion, permanent rejection, or retry exhaustion. A persistent queue needs a storage extension, durable storage, and a way for the replacement Collector to recover that storage. See exporter helper configuration.
The example uses a Groundcover ingestion key. That is different from an API key used to manage dashboards or query an API. Store it in a Kubernetes Secret and inject it into the exporter process’s environment. The Bearer header is supported by the Groundcover Collector example.
Groundcover ingestion, storage, and queries
The OTLP HTTP exporter uses a base HTTPS endpoint. It sends logs, including Kubernetes Events represented as log records, to /v1/logs and metrics to /v1/metrics. Do not put /v1/logs in a shared base endpoint and expect it to serve metrics too. See Groundcover ingestion endpoints.
The backend path is conceptually:
OTLP request → authentication and decoding → backend processing → storage → queries
Groundcover documents ClickHouse for persistent logs, Events, and traces, and VictoriaMetrics for metrics. VictoriaMetrics provides a PromQL-compatible query interface. These stores run inside your environment in BYOC. The exact internal normalization and storage routing are backend implementation details, rather than additional Collector processors. See Groundcover architecture.
An HTTP request leaving the Collector does not prove the record is queryable. The exporter still needs to handle the response, and backend processing must complete. Check the final cluster, environment, workload, namespace, Pod, job, and instance values in queries instead of assuming the original attribute names become identical query fields.
For our log example, that means finding the original JSON message under rnd-cluster and development, with Pod api-123 in default, rather than under the Fluent Bit or Collector Pod. For the KSM example, it means querying the available-replica value for Deployment api in backend, not confusing it with the identity of the KSM exporter.
Reliability, scaling, and validation
The pipeline has several places that hold state. Each protects a different boundary.
Where data can be lost or duplicated
| Boundary | What it establishes | What it does not establish |
|---|---|---|
| Runtime log file | Bytes exist on that node until retention removes them | Permanent retention while a collector is down |
| Tail SQLite offset | A saved reading position | Successful downstream delivery |
| Fluent Bit memory chunks | Temporary holding of parsed records | Survival of a process or node failure |
| Fluent Bit filesystem chunks, if enabled | Local payload persistence | Survival of lost storage or exhausted output retention/retries |
| Forward TCP write without ACK | Bytes were handed to the transport without a detected write failure | Collector processing or backend persistence |
| Forward ACK in Collector 0.110.0 | Receiver decoded and queued the event internally | Successful downstream processing or durable export |
| Identity filter | Accepted records meet the configured identity rules | Preservation of rejected but otherwise useful logs |
| OTel in-memory sending queue | Temporary buffering before export | Restart survival or unlimited outage tolerance |
| Successful export response | The ingestion endpoint accepted the request according to its response | An independent verification of storage and query correctness |
| Static scrape sharding | A target has a designated owner under consistent configs | Automatic failover or historical recovery of missed scrapes |
Fluent Bit’s Require_ack_response can strengthen the sender-to-receiver handoff, but the 0.110.0 ACK implementation acknowledges before downstream completion. The complete path should not be called exactly-once or guaranteed at-least-once delivery. Retries after uncertain failures can also introduce duplicates.
For filesystem buffering, enable storage.type filesystem on the relevant Fluent Bit input and set the service storage path. Then size memory-resident chunks and disk retention, including an output storage.total_limit_size. Mem_Buf_Limit no longer plays the same role as in the memory-only configuration. Enabling disk storage without a disk budget merely moves the pressure elsewhere.
What matters as the cluster grows
The historical Fluent Bit resources—50m CPU and 64Mi requested, with limits of 200m CPU and 256Mi—are example allocations. They are not evidence of capacity for a particular cluster size. The same applies to two Node shards and a 10,000-request exporter queue.
Size the deployment using the work it performs:
- Logs per second, bytes per second, line-size distribution, and files per node.
- Metadata lookup rate, cache size, Pod churn, and the size of Pod API responses.
- Scrape target count, samples per scrape, scrape duration, and interval.
- Additional scrapes from bundled Prometheus and traffic through the API proxy.
- Queue growth and recovery speed during a backend outage.
- CPU, memory, and network load per Logs Collector replica and Node shard.
For example, 1,000 node targets scraped every 30 seconds average about 33 target scrapes per second before adding cAdvisor as a separate job, application endpoints, or bundled Prometheus. That is only arithmetic, not a throughput benchmark; response size and scrape duration determine much of the cost.
The Logs Collector can use an HPA, but long-lived Forward connections may leave traffic unevenly distributed after scaling. Observe per-replica load and connection behavior. Scaling down also needs enough time to stop accepting work and drain queued exports; the shutdown grace period does not itself make an in-memory queue durable.
There are no load-test results attached to this historical setup, so its tested capacity remains unspecified.
Check the flow at each boundary
Before running the examples, validate the rendered configurations with the exact Fluent Bit and Collector versions. A valid YAML file alone does not validate plugin names, OTTL statements, RBAC, or receiver activation.
Then follow a small known sample through the system:
- File collection: emit a unique test line from an application Pod. Confirm its CRI file and symlink on the node, then confirm Fluent Bit reads it.
- Parsing: inspect the timestamp,
log, andlog_processedfields in an isolated diagnostic path. Test plain text and JSON separately, and test partial/multiline records if the workload produces them. - Identity: send distinct markers from two Pods. Verify that they become separate Resources with their own Pod UIDs. Recreate one Pod and verify the new UID is used.
- Rejection behavior: test a malformed tag or missing metadata in an isolated pipeline. Check that rejection is observable and matches the declared drop or quarantine policy.
- Events: compare the Event UID and involved-object UID from the API with the exported record. Verify Pod association only for Pod-kind objects, and inspect repeated count updates.
- Metric ownership: inspect targets in the rendered shard configurations and receiver diagnostics. Each intended endpoint should have one OTel scrape owner across overlapping jobs, except for an explicitly designed replicated path.
- Federation: verify the recording rule exists, its expression evaluates, and
match[]selects only the intended output. Check its labels against the dashboard query. - Delivery: verify ingestion responses and query the sample in Groundcover using the intended cluster and workload fields.
For a staging reliability check, also observe a restart, a shard failure, an Infra rollout, and a short backend outage. Measure missing and repeated data rather than inferring guarantees from configuration flags.
Fluent Bit’s HTTP server exposes its own health and metrics endpoints on port 2020 when enabled. The Collector can expose internal metrics on 8888 and a health extension on 13133, but each listener must be configured, enabled, and reachable. Scrape every Collector replica rather than a load-balanced address that hides which instance is being observed.
Watch accepted/refused telemetry, exporter failures, queue size/capacity, process memory, and scrape health. Also record or inspect filter-specific rejection counts where available in the pinned version. Receiver acceptance alone does not show what later filters dropped. A healthy process can still be exporting no useful data.
Closing thoughts
The easiest mistake to make with Kubernetes observability is to think of logs, Events, and metrics as one pipeline. They eventually meet in the same observability stack, but they start in different places, are collected in different ways, and fail for different reasons.
Logs usually begin on the node, Events come from the Kubernetes API, and metrics may be scraped, derived from cluster state, or sent directly over OTLP. By the time they reach the backend, those differences can be easy to forget, but they are exactly what matter when something goes wrong.
When a signal is missing, delayed, duplicated, or attached to the wrong workload, the most useful approach is to follow one example all the way through. Start at the source, confirm that it was collected, check how it was parsed and identified, then follow it through processing, queueing, export, and finally into the backend.
Once you start looking at observability this way, a large and complicated Kubernetes telemetry stack becomes much easier to reason about. Instead of debugging “observability” as one system, you are debugging a series of smaller data flows, each with a clear source, owner, and set of failure points.
The tooling and architecture will change over time, but that way of thinking remains useful.